Customer Logins
Obtain the data you need to make the most informed decisions by accessing our extensive portfolio of information, analytics, and expertise. Sign in to the product or service center of your choice.
Customer Logins
EQUITIES COMMENTARY
Nov 18, 2015
S&P 500 (narrowly) breaks even for year
Price momentum has proven pivotal in 2015 as a few key stocks have held the S&P 500 index above water.
- The third of US shares trading closest to a 52 week high have outperformed by 0.8% per month on average
- Momentum outperforms the S&P 500 year to date by 6.2% as investors follow price movers
- Despite outperforming market, plenty of high momentum names attract bearish sentiment
A rally of the few
Goldman Sachs released a report this week highlighting that the breadth of the US market performance year to date, across the S&P 500, is at its most narrow in 30 years. Strong performances from a few key names have lifted the index higher while only 43% of constituents are actually up. Besides General Electric, among the top ten performers on the S&P 500 (contributing on a weighted basis), all other stocks reside in the Information Technology and Consumer Discretionary sectors.
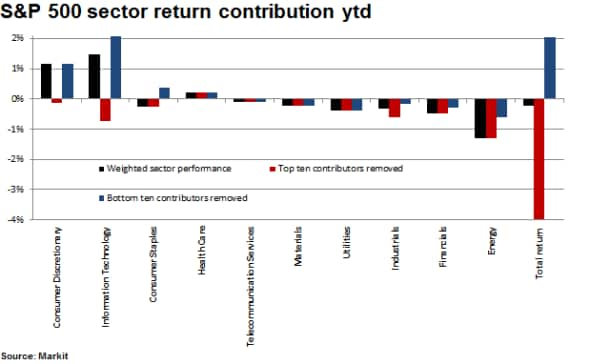
Removing the market weighted performances of the top ten stocks in the S&P 500, and conversely the bottom ten, reveals the “bull bar” performance of stocks year to date.
Removing these outliers clearly indicates that top performing names have been in the aforementioned sectors and have lifted the index proportionately higher than the bottom has pulled it down. Energy, Financials and Industrials have been responsible for the bulk of underperformance year to date.
Active exposure to healthcare declines
Another indication of this market’s narrow price return and dependence on high volatility names can be tracked by looking at the performance of names relative to their yearly highs as gauged by Markit’s Research Signals 52 Week High factor.
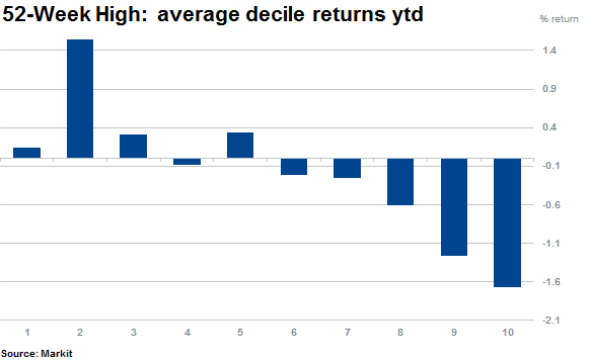
The factor shows that shares trading closest to their yearly highs have clearly outperformed the market in the last 11 months. Across a large cap universe of over 1,100 stocks, 50% of names with high levels of price momentum have clearly outperformed the bottom 50% of names. This is even more pronounced in the worst ranked deciles, which are made up of the shares furthest away from a 52 week high. In short, the shares which have managed to climb in the current market have continued to do so while those on the other end of the scale have continued to face headwinds.
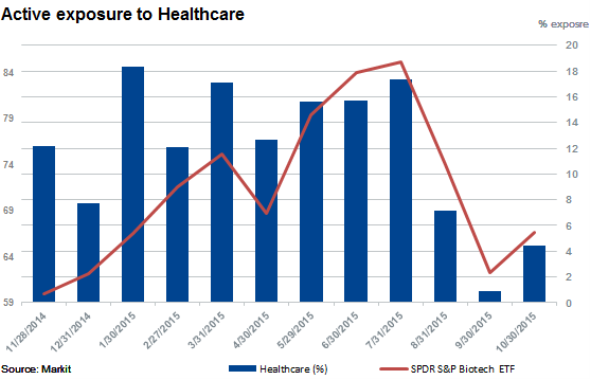
One particular exception to the rule has been healthcare shares, which have come under pressure in recent months. Post the selloff in Biotech and Healthcare, the factor’s exposure to healthcare shares fell two-thirds as the proportion of the sector’s representation among the best ranked 10% of shares fell from 17.3% to 7.1% in August and then below 1% in September before increasing again in October.
Momentum delivers, attracts shorts
The iShares MSCI USA Momentum Factor ETF has outperformed the S&P 500 by 5.3% year to date (on a total return basis) which has been driven in large part due to its overweight exposure (50% exposure) to key names in the Consumer Discretionary and Information Technology sectors.
The SPDR S&P 500 ETF trades at a price earnings ratio (historical) of 19 and is high by historical measurements but well below the iShares MSCI USA Momentum Factor ETF’s ratio of 28. Accordingly, short sellers have been attracted to some higher profile names that have displayed significant price momentum.
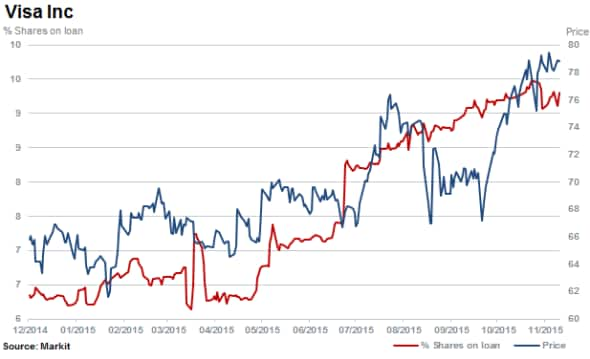
The third largest constituent of the ETF, Visa, has seen shares rise 21% year to date, attracting short sellers over the last 12 months with shares outstanding on loan increasing to 9.3%.
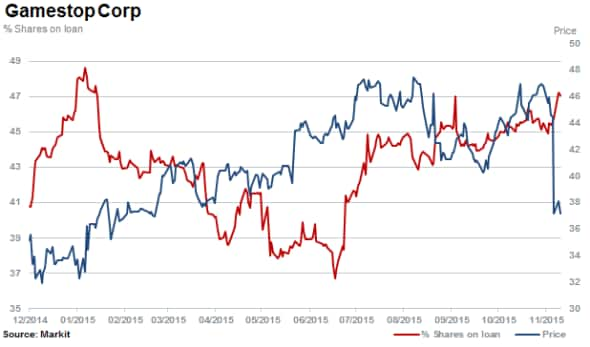
Gamestop is the most shorted momentum stock (and part of the iShares momentum ETF) and has ranked as the most shorted in the S&P 500 for some time. Before the stock fell 17% last week on November 13th, it was up 32% over 12 months. The fall has rewarded ever patient short sellers who have tracked the stock for over two years.
Relte Stephen Schutte, Analyst at IHS MarkitM
Tel: +44 207 064 6447
relte.schutte@ihsmarkit.com
S&P Global provides industry-leading data, software and technology platforms and managed services to tackle some of the most difficult challenges in financial markets. We help our customers better understand complicated markets, reduce risk, operate more efficiently and comply with financial regulation.
This article was published by S&P Global Market Intelligence and not by S&P Global Ratings, which is a separately managed division of S&P Global.
{"items" : [
{"name":"share","enabled":true,"desc":"<strong>Share</strong>","mobdesc":"Share","options":[ {"name":"facebook","url":"https://www.facebook.com/sharer.php?u=http%3a%2f%2fstage.www.spglobal.com%2fmarketintelligence%2fen%2fmi%2fresearch-analysis%2f18112015-equities-s-p-500-narrowly.html","enabled":true},{"name":"twitter","url":"https://twitter.com/intent/tweet?url=http%3a%2f%2fstage.www.spglobal.com%2fmarketintelligence%2fen%2fmi%2fresearch-analysis%2f18112015-equities-s-p-500-narrowly.html&text=S%26P+500+(narrowly)+breaks+even+for+year","enabled":true},{"name":"linkedin","url":"https://www.linkedin.com/sharing/share-offsite/?url=http%3a%2f%2fstage.www.spglobal.com%2fmarketintelligence%2fen%2fmi%2fresearch-analysis%2f18112015-equities-s-p-500-narrowly.html","enabled":true},{"name":"email","url":"?subject=S&P 500 (narrowly) breaks even for year&body=http%3a%2f%2fstage.www.spglobal.com%2fmarketintelligence%2fen%2fmi%2fresearch-analysis%2f18112015-equities-s-p-500-narrowly.html","enabled":true},{"name":"whatsapp","url":"https://api.whatsapp.com/send?text=S%26P+500+(narrowly)+breaks+even+for+year http%3a%2f%2fstage.www.spglobal.com%2fmarketintelligence%2fen%2fmi%2fresearch-analysis%2f18112015-equities-s-p-500-narrowly.html","enabled":true}]}, {"name":"rtt","enabled":true,"mobdesc":"Top"}
]}


