Customer Logins
Obtain the data you need to make the most informed decisions by accessing our extensive portfolio of information, analytics, and expertise. Sign in to the product or service center of your choice.
Customer Logins
EQUITIES COMMENTARY
Dec 21, 2016
Securities lending: year in review
2016 has been a banner year for securities lending, as tracked by the revenues generated by assets in lending programs.
- Lending revenues are set for their best year since 2012
- US stocks drove most of the revenue uplift as short sellers regained appetite
- Germany, Hong Kong and ETFs were the least active areas this year
2016 has delivered more than its fair share of shock political outcomes, market volatility and growth concerns, which in turn helped the securities lending industry register its strongest revenue year since 2012. The $15 trillion plus of assets in lending programs tracked by the Markit Securities Finance Database have so far generated $8.06bn of revenues for the year to December 20th, which is more than the $7.81bn of aggregate revenues earned by the group over the whole of last year. This trajectory puts the industry on track to generate around 6.3% more revenue than 2015, which would make 2016 the top revenue generating year in over five years.
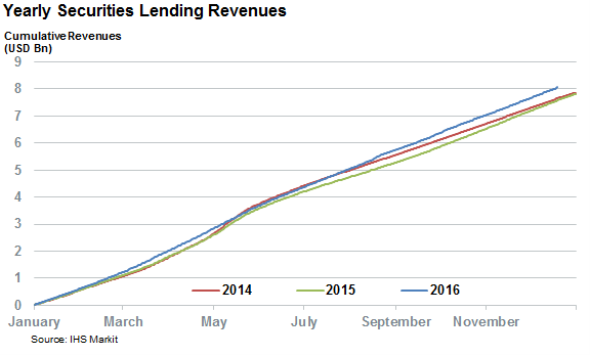
The bumper revenue haul has been mostly driven by lenders being able to achieve better pricing for their loans as the weighted average fees achieved year to date, 43.8bps, were 1.1bps higher than those achieved in 2015. Demand was flat over the year as the average balance was $1.45 trillion, the same number registered over 2015.
While the supply did increase by 3.5%, this increase was less than that registered in the revenues generated, which means that the assets in lending programs have already returned 5.27bps for the year to date - overtaking the 5.15bps generated last year.
Despite these relatively strong high level earnings figures, it's worth noting that overall performance was not evenly spread across all markets and asset classes.
US powers industry growth
For North American equities, led by the US, stocks were the single largest contributor to 2016's revenue haul. The region's equities, which generated 40% of the global securities lending revenues last year, is on track to beat last year's revenue tally by roughly 8% after registering a strong 9% jump in loan balances.
This increase in balances can be attributed to elevated shorting activity in the wake of market volatility as evidenced by the fact that the high water mark in demand to borrow shares of the constituents of the S&P 500 stood at 3% of shares outstanding over the year, over a fifth more than the 2.4% registered in 2015. Unsurprisingly, energy producers were at the forefront of this wave of shorting activity as demand to borrow their shares was three times higher than the rest of the index. Despite the recent rebound in oil prices, the sector is still responsible for a fifth of the North American shares trading special as many producers continue to face headwinds, with oil trading in the $50-55 range.
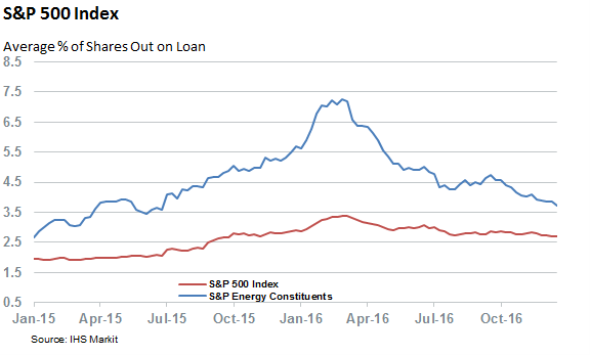
While the rebound in oil prices has dampened the urge to short sell energy stocks overall and which has seen US equity loan balances shrink slightly from the highs registered in the first quarter, the current demand to borrow S&P 500 constituents is still elevated when compared to levels registered in the three previous years which puts the industry on a good footing heading into 2017.
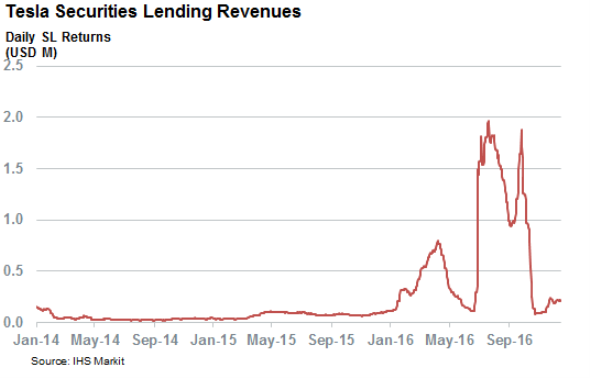
While short targets were numerous across the year one stock, Tesla, deserves a special mention for its outsized contribution to the industry's revenues. The electric carmaker's sky high valuation, which saw it feature in several activist short reports, attracted short sellers in force with demand to borrow its shares never falling below 15% of shares outstanding. Short sellers were willing to pay a hefty price to stay short Tesla as the fee charged to borrow averaged 5% over the year. Holders of Tesla shares which were willing to lend them out benefited tremendously from this combination of persistently high demand and high fees as they shared over $228m of securities lending revenues between them. In fact the increase in revenues generated in Tesla alone was responsible for the entirety of the revenue lift experienced by US equity securities lending over the last year.
Canadian equities, which include many primary energy producers as well as banking stocks which rely on the fortune of energy producing regions, have also saw a significant lift in fees generated. Overall Canadian Equities are so far 13% ahead of last year's tally which puts them on track to deliver 19% higher revenues than last 2015's total.
ADRs also enjoyed a strong year as demand to borrow Alibaba shares in order to play the Yahoo stub trade means that the asset class is set to earn a third more returns for lenders than it did in 2015.
Challenges in Europe
European equities revenues on the other hand didn't enjoy nearly the same lift in fees generated than their peers on the other side of the Atlantic. Overall revenues are roughly $115m behind the same point last year; at this pace revenues are set to miss last year's tally by 7%.
The largest single contributor to this trend is the unwinding of the German yield enhancement trade which has seen the year to date revenues generated by German equities shrink by a massive 62%, putting a $230m hole in the industry's revenue.
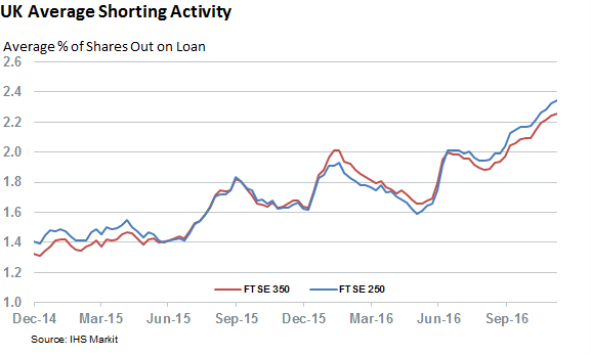
While the German market has proved challenging, the UK has helped plug some of the revenue gap as the country has generated over $35m more revenues for the year to December 20th than the full year 2015 tally which puts it on track to generate 27% more revenues for the year. Uncertainty surrounding Brexit has been the main catalyst driving the increased UK revenues as short selling in UK equities has surged to a multi-year high since the referendum vote back in June. These dynamics show no signs of slowing down heading into 2017 as the current average demand to borrow constituents of the FTSE 350 index stands at 2.3% of shares outstanding, the highest in over two years. Domestic stocks which are disproportionally represented in the midcap FTSE 250 index are those most targeted by short sellers since the referendum as the index has seen the demand to borrow its constituents jump by over a third, much more than the 25% experienced in the wider 350 index.
The jump in UK equity volatility has also boosted the profitability of UK scrip dividend trades where investors take advantage of the built in optionality offered when companies give investors the option to receive payments in either cash or shares. Optionality is magnified for companies which pay dollar denominated dividends as scrip dividends, such as HSBC, as scrip trades offer both equity and foreign exchange optionality. To this end HSBC generated $10m more revenues for beneficial owners over the week surrounding each of its four 2016 dividends payments which is over two and a half times that generated over similar periods in 2015.
Scandinavia has also provided performed very strongly with every market across the region registering a lift in revenues.
Sweden has played an outsized role in this trend as the $233m of revenues generated from lending the country's equities puts it on track to deliver 45% more revenues than it did over 2015. This increase was driven by a 22% increase in the demand to borrow Swedish equities as well as better pricing dynamics as the fees generated by these loans have increased by a fifth to 260bps year to date.
Asian revenues mixed
Asia delivered a mixed bag for beneficial owners although the headline earnings generated by the region were much more buoyant as revenues are on track to beat last year's total by 11%.
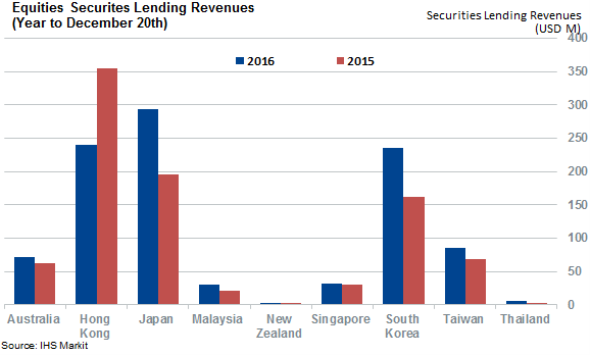
Japan was the single largest driving force behind this trend, helped by the fact that fees needed to borrow Japanese equities jumped by a massive 33%. Revenues, which are on track to beat the previous year's total by 50%, were further boosted by a 12% increase in average on loan balances. This large jump in revenues means that Japan is now the single largest revenue contributor in Asia - overtaking previous top revenue generator, Hong Kong.
Hong Kong has been another key disappointment for the industry year to date as beneficial owners stand to make a third less revenues from lending out equities in the market, compared to 2015. This revenue drought is driven in large part by a decline in shorting activity as the number of stocks with more than 3% of their shares outstanding on loan has fallen from 75 to 64. This apparent loss of appetite from short sellers means that lenders experienced a sharp fall in balances in the region along with their ability to dictate loan terms. The latter point is exemplified by the fact as that the average fee to borrow Hong Kong Equities over the year was a quarter lower than that registered in 2015.
Hong Kong is in jeopardy of falling even further down the region's revenue league table as from South Korean equities experienced another bumper year, with the country on track to generate 45% more revenues for beneficial owners which could see it pip Hong Kong to the second place of the Asian revenue table. As in Japan, the revenue uplift was driven by a combination of fees and balances which have were both up significantly up on the year.
2016 was a profitable year for emerging Asian markets as the revenues generated by Malaysian and Thai equities are set to beat last year's number by 45% and 90% respectively. Though both markets are still relatively small, the $10m of extra revenue generated year to date by both countries is significant as it contributed to a tenth to the industry's revenues uplift over the region.
ETFs revenues lose momentum
While conventional equities experienced a strong year, ETFs have by and large failed to continue to deliver the strong revenue growth experienced over the last few years as the asset class in on track to miss last year's revenue total by 10%.
US ETFs, which generated 90% of the fees last year, were the main culprit for these disappearing revenues as lenders looked to have lost some pricing power in the asset class as the current 57bps weighted average fees charged to borrow US ETFs represents a 10bps retreat from the average fees charged over 2015 despite relatively flat loan levels. Increases in inventories look to have been the driving force behind this change in pricing dynamics as the average value of ETF inventory levels increased by over 8% to $98bn.
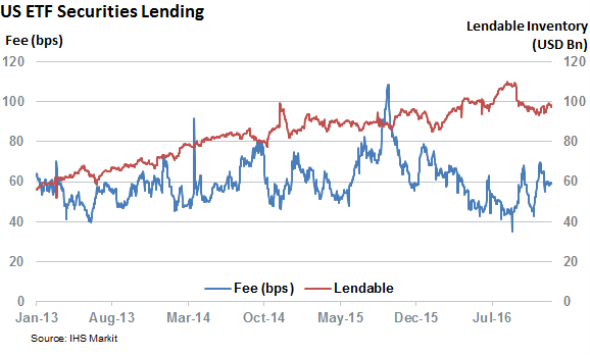
European ETFs has a relatively better year and the asset class is on track to generate roughly 4% more revenues for lenders over the year. This revenue uplift was mostly driven by an increase in average loan balances which are up by 9% from that seen in 2015.
Like their US listed peers, European ETFs experienced a large increase in lending program availability as there is now $31bn of such assets in lending programs 10% more than at the start of the year. This increase in availability had a slight impact on the fees generated, but not enough to materially impact the revenue figure which was driven by the previously mentioned increase in on loan balances.
Bonds strong contributors
With both bond and equities sharing equal billing on news headlines over the last year, it's only fitting that the asset class partake in the bumper revenue haul. In fact bonds have contributed to half of the revenue uplift year to date, a number which was entirely driven by better pricing power as the demand to borrow bonds across the world actually fell by 5% from 2015's figures. This improved pricing power drove a 13% increase in revenues across the asset class which sets it up for its largest revenue haul since 2012.
This jump in revenues, which will finish the year at over $250m, was evenly distributed across corporate and government bonds - the former of the two has enjoyed a much better 2016 as this represents a massive 23% increase on 2015's revenues.
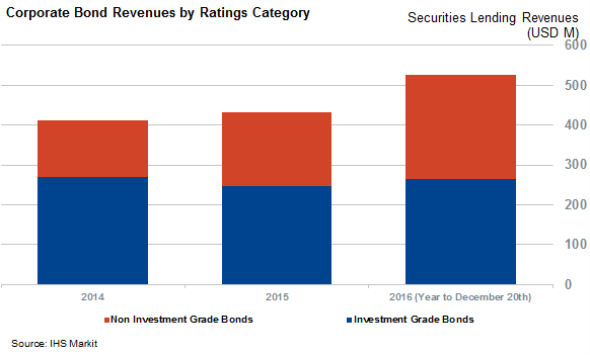
A further dive into the numbers shows that most of the extra corporate bond revenues were generated in the non-investment grade space which experienced a massive 50% increase in revenues. While industry watchers may find this sudden rush to lend out high yield corporate bonds an alarming sight given the liquidity concerns surrounding the asset class, our analysis shows that the industry has by and large done a good job at keeping on top of bond market liquidity issues as the vast majority of corporate bonds now on loan are in the liquid end of the liquidity spectrum, as gauged by the Markit Pricing bond liquidity scores.
Government bonds, which are 60% cheaper to borrow than their corporate peers had a relatively more subdued year as revenues generated by the asset class are only set to grow by 10%. Unlike corporates bonds, however, this revenue growth was driven by the most prosaic end of the asset class as market participants turned to securities lending to source high quality assets to post as collateral.
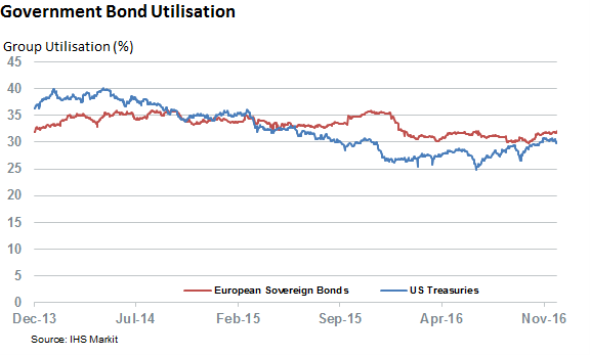
US government bonds were at the forefront of that trade and the fees required to borrow treasuries jumped by over a third to 6.3bps. Eurozone sovereign bonds, which are becoming increasingly scarce due to the pace of ongoing QE in the region, also registered a large rise in fees which pushed their borrow rate to the highest levels since the eurozone financial crisis.
Interestingly, beneficial owners are increasingly reluctant to lend these high quality assets as the utilization rate of both US treasuries and Eurozone sovereign bonds fell to a three year low over the year.
Simon Colvin | Research Analyst, Markit
Tel: +44 207 264 7614
simon.colvin@markit.com
S&P Global provides industry-leading data, software and technology platforms and managed services to tackle some of the most difficult challenges in financial markets. We help our customers better understand complicated markets, reduce risk, operate more efficiently and comply with financial regulation.
This article was published by S&P Global Market Intelligence and not by S&P Global Ratings, which is a separately managed division of S&P Global.
{"items" : [
{"name":"share","enabled":true,"desc":"<strong>Share</strong>","mobdesc":"Share","options":[ {"name":"facebook","url":"https://www.facebook.com/sharer.php?u=http%3a%2f%2fstage.www.spglobal.com%2fmarketintelligence%2fen%2fmi%2fresearch-analysis%2f21122016-equities-securities-lending-year-in-review.html","enabled":true},{"name":"twitter","url":"https://twitter.com/intent/tweet?url=http%3a%2f%2fstage.www.spglobal.com%2fmarketintelligence%2fen%2fmi%2fresearch-analysis%2f21122016-equities-securities-lending-year-in-review.html&text=Securities+lending%3a+year+in+review","enabled":true},{"name":"linkedin","url":"https://www.linkedin.com/sharing/share-offsite/?url=http%3a%2f%2fstage.www.spglobal.com%2fmarketintelligence%2fen%2fmi%2fresearch-analysis%2f21122016-equities-securities-lending-year-in-review.html","enabled":true},{"name":"email","url":"?subject=Securities lending: year in review&body=http%3a%2f%2fstage.www.spglobal.com%2fmarketintelligence%2fen%2fmi%2fresearch-analysis%2f21122016-equities-securities-lending-year-in-review.html","enabled":true},{"name":"whatsapp","url":"https://api.whatsapp.com/send?text=Securities+lending%3a+year+in+review http%3a%2f%2fstage.www.spglobal.com%2fmarketintelligence%2fen%2fmi%2fresearch-analysis%2f21122016-equities-securities-lending-year-in-review.html","enabled":true}]}, {"name":"rtt","enabled":true,"mobdesc":"Top"}
]}


