Customer Logins
Obtain the data you need to make the most informed decisions by accessing our extensive portfolio of information, analytics, and expertise. Sign in to the product or service center of your choice.
Customer Logins
EQUITIES COMMENTARY
Feb 25, 2015
Oil and gas: model returns
Despite the recent oil rout investors would have been able to gain an edge on commodities markets, as evidenced by the performance of Markit Research Signals' Oil and Gas model.
- Robust returns delivered throughout the most volatile trading period in oil's recent history
- Average returns of 2.2% per month with a 90% hit rate since inception
- An impressive 15.4% long-short return spread achieved despite oil prices declines of 45%
Profiting from oil's plunge
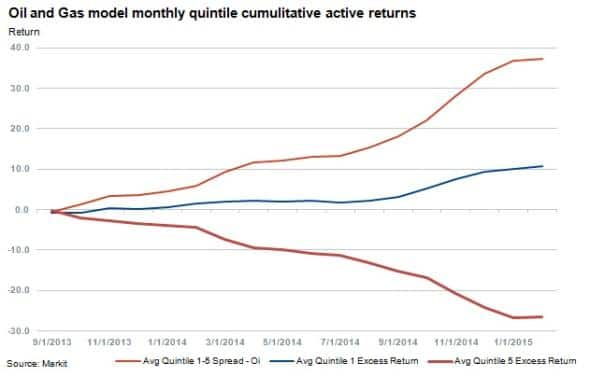
Markit's Oil and Gas multifactor model uses industry specific metrics to rank oil and gas companies and has delivered strong performances in recent months while oil prices have plummeted. Model returns were derived from success in identifying low momentum and sentiment names to avoid - a trigger for long only funds to sell and short in long-short strategies.
The model has returned 2.2% on average since inception in September 2013 and has most notably been successful during the recent oil price rout, posting a cumulative 15.4% long-short return spread from October to December last year.

Flight to quality oil and gas assets can be seen in the quintile 1 (top ranking names) excess returns versus quintile 5 above.
Winners and losers
While the costs to borrow oil and gas stocks increased in November and December of 2014, ETF investors globally turned more positive towards oil and gas investments over this period with flows turning positive in October and reaching $3bn in December, the highest level since February 2011.
The model has delivered a stellar performance since August 2014 with an average return spread of 3.94%, 177 bps above the full period result. The highest monthly return spreads since the model's inception occurred in the months of October through December 2014.
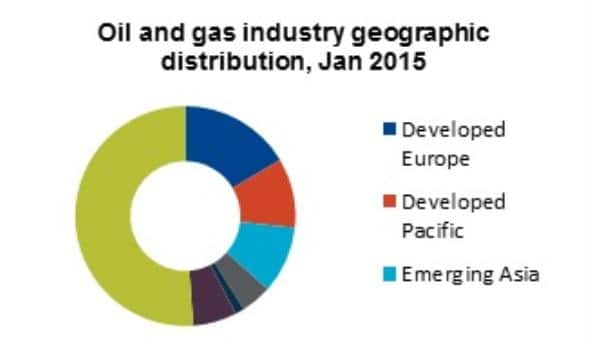
The single names that make up the universe of the model have grown from 340 names to over 400 names by January 2015. The coverage includes developed markets in Europe, Pacific and North America, as well as emerging markets in EMEA, Asia and Latin America.

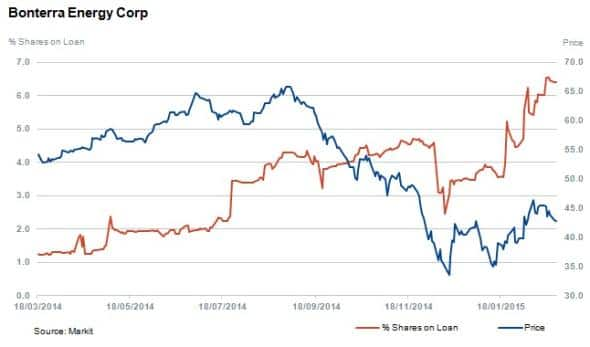
Companies which currently rank high with regards to positive scores across component factors include Bonterra Energy, Eni SpA and Murphy Oil. Bonterra currently ranks well in terms of value, momentum & sentiment and management quality but low regarding the growth factor.

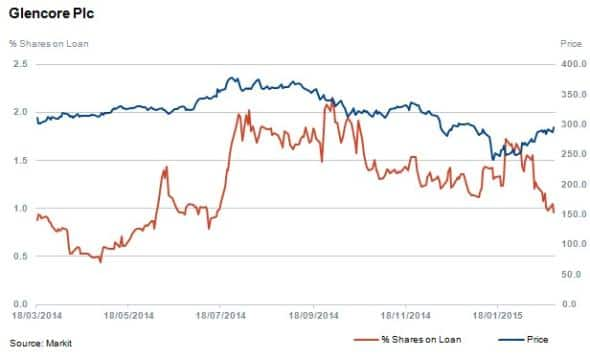
At the other end of the scale, companies that have ranked poorly and score unattractively across factors have been responsible for a large proportion of recent returns via short positions. Current examples of these stocks that are relatively less expensive to borrow include Formosa Petrochemical, Glencore and Laredo Petroleum. Glencore currently ranks poorly in all factors with specifically low rankings for momentum & sentiment and growth.

Model architecture
The Oil and Gas model draws on a comprehensive arsenal of style and industry stock selection metrics and models firms systematically using a multifactor strategy. Employing industry specific operating metrics, such as production numbers and reserve amounts, the model is organised and weighted into a multifactor methodology that encompasses four broad investment styles:
- Management Quality 30%
- Growth 20%
- Value 30%
- Momentum & Sentiment 20%
*To access the full report on the modules, factor details, single names and current rankings of the Markit Oil and Gas model and others, please contact us.
Relte Stephen Schutte | Analyst, Markit
Tel: +44 207 064 6447
relte.schutte@markit.com
S&P Global provides industry-leading data, software and technology platforms and managed services to tackle some of the most difficult challenges in financial markets. We help our customers better understand complicated markets, reduce risk, operate more efficiently and comply with financial regulation.
This article was published by S&P Global Market Intelligence and not by S&P Global Ratings, which is a separately managed division of S&P Global.
{"items" : [
{"name":"share","enabled":true,"desc":"<strong>Share</strong>","mobdesc":"Share","options":[ {"name":"facebook","url":"https://www.facebook.com/sharer.php?u=http%3a%2f%2fstage.www.spglobal.com%2fmarketintelligence%2fen%2fmi%2fresearch-analysis%2f25022015-Equities-Oil-and-gas-model-returns.html","enabled":true},{"name":"twitter","url":"https://twitter.com/intent/tweet?url=http%3a%2f%2fstage.www.spglobal.com%2fmarketintelligence%2fen%2fmi%2fresearch-analysis%2f25022015-Equities-Oil-and-gas-model-returns.html&text=Oil+and+gas%3a+model+returns","enabled":true},{"name":"linkedin","url":"https://www.linkedin.com/sharing/share-offsite/?url=http%3a%2f%2fstage.www.spglobal.com%2fmarketintelligence%2fen%2fmi%2fresearch-analysis%2f25022015-Equities-Oil-and-gas-model-returns.html","enabled":true},{"name":"email","url":"?subject=Oil and gas: model returns&body=http%3a%2f%2fstage.www.spglobal.com%2fmarketintelligence%2fen%2fmi%2fresearch-analysis%2f25022015-Equities-Oil-and-gas-model-returns.html","enabled":true},{"name":"whatsapp","url":"https://api.whatsapp.com/send?text=Oil+and+gas%3a+model+returns http%3a%2f%2fstage.www.spglobal.com%2fmarketintelligence%2fen%2fmi%2fresearch-analysis%2f25022015-Equities-Oil-and-gas-model-returns.html","enabled":true}]}, {"name":"rtt","enabled":true,"mobdesc":"Top"}
]}


