Customer Logins
Obtain the data you need to make the most informed decisions by accessing our extensive portfolio of information, analytics, and expertise. Sign in to the product or service center of your choice.
Customer Logins
BLOG
Jun 05, 2019
Corporate Bond Pricing Data, May 2019 Recap
In this week's post, Michael Skorczynski from our IHS Markit Corporate Bond Pricing team has highlighted U.S. Treasury movement for May 2019, and delivered a review of the Investment Grade market sector and key up/down movers within the Investment Grade market. His observations are drawn from our Corporate Bond pricing data via the IHS Markit Price Viewer.
US Treasury Movement
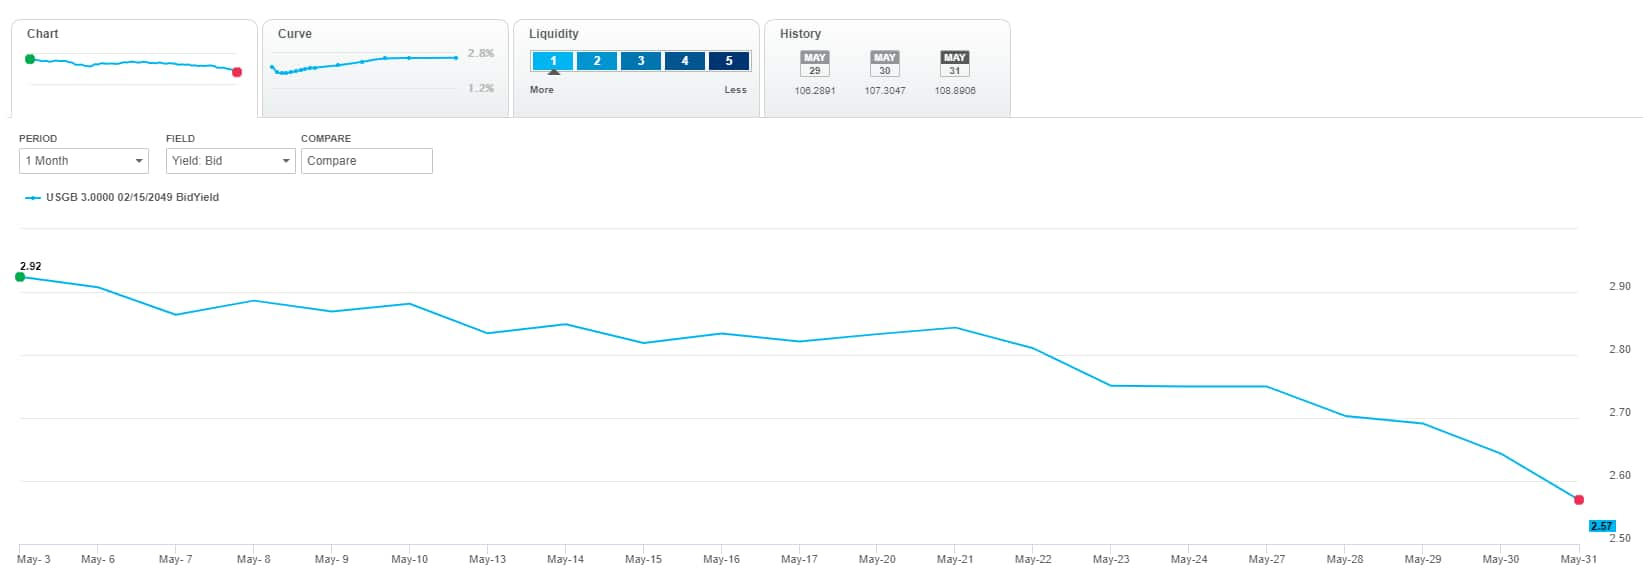
Over the month of May, the US Treasury curve has tightened. The table below summarizes weekly and monthly performance across the curve, followed by a snap of the 30 year's performance in more detail, sourced from our Price Viewer portal.


Investment Grade Market Sector Review
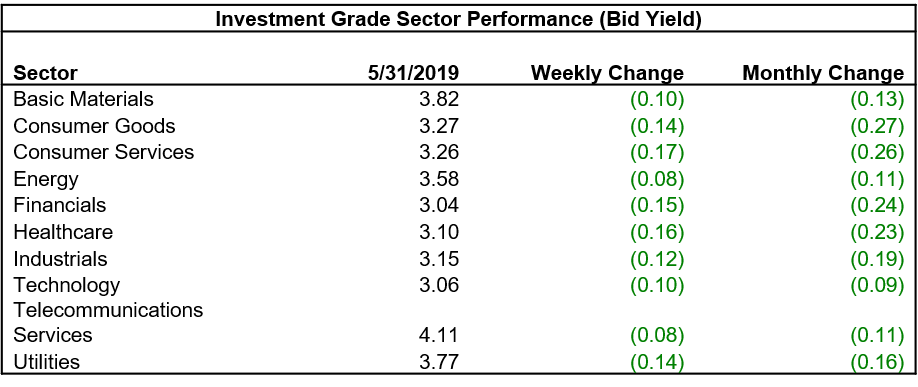
The table below summarizes weekly and monthly sector performance across the iShares iBoxx $ Investment Grade Corporate Bond ETF.

Top Movers (up/down) within the Investment Grade Market
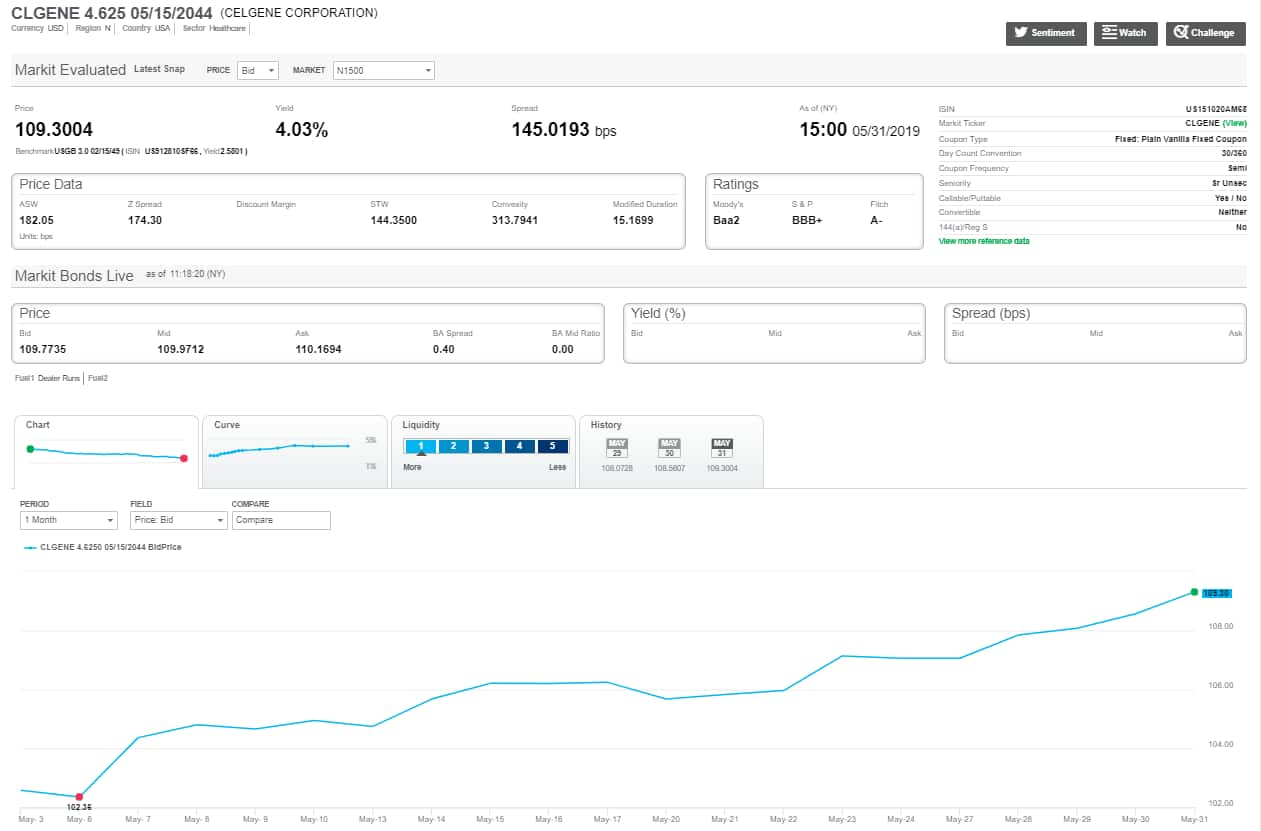
May's best performing IHS Markit iBoxx USD Investment Grade Index bond: CELGENE 4.625% '44 (US151020AM68)
- This bond increased in price value by $7.94, from $101.36 to $109.30
- This bond's credit spread tightened by 16 basis points, from +160 to +144
- In early May, Bristol-Myers announced a $19 Billion debt issuance to fund its purchase of Celgene
The following data snap from our Price Viewer portal displays the bond's price movement over the last month.

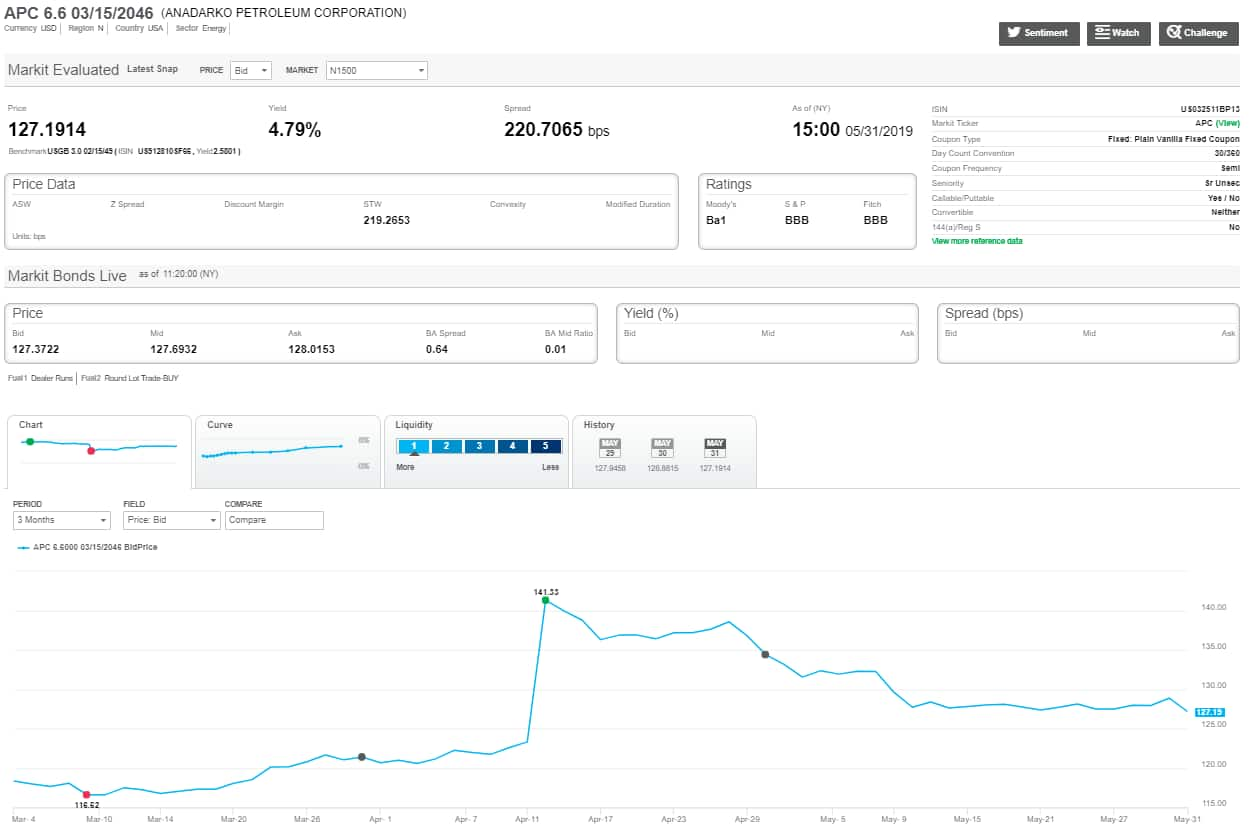
May's worst performing IHS Markit iBoxx USD Investment Grade Index bond: ANADARKO PETROLEUM 6.6% '46 (US032511BP13)
- This bond decreased in price value by $7.23, from $ 134.42 to $ 127.19
- This bond's credit spread widened by 74 basis points, from +145 to +219
- Anadarko's volatility over the last two months can be attributed to the acquisition offers made by Occidental Petroleum and Chevron (see last month's post: A Bond Evaluation of the Anadarko Petroleum Acquisition)
The following data snap from our Price Viewer portal shows the bond's price movement over the last 3 months.

S&P Global provides industry-leading data, software and technology platforms and managed services to tackle some of the most difficult challenges in financial markets. We help our customers better understand complicated markets, reduce risk, operate more efficiently and comply with financial regulation.
This article was published by S&P Global Market Intelligence and not by S&P Global Ratings, which is a separately managed division of S&P Global.
{"items" : [
{"name":"share","enabled":true,"desc":"<strong>Share</strong>","mobdesc":"Share","options":[ {"name":"facebook","url":"https://www.facebook.com/sharer.php?u=http%3a%2f%2fstage.www.spglobal.com%2fmarketintelligence%2fen%2fmi%2fresearch-analysis%2fcorporate-bond-pricing-data-may-2019-recap.html","enabled":true},{"name":"twitter","url":"https://twitter.com/intent/tweet?url=http%3a%2f%2fstage.www.spglobal.com%2fmarketintelligence%2fen%2fmi%2fresearch-analysis%2fcorporate-bond-pricing-data-may-2019-recap.html&text=Corporate+Bond+Pricing+Data%2c+May+2019+Recap+%7c+S%26P+Global+","enabled":true},{"name":"linkedin","url":"https://www.linkedin.com/sharing/share-offsite/?url=http%3a%2f%2fstage.www.spglobal.com%2fmarketintelligence%2fen%2fmi%2fresearch-analysis%2fcorporate-bond-pricing-data-may-2019-recap.html","enabled":true},{"name":"email","url":"?subject=Corporate Bond Pricing Data, May 2019 Recap | S&P Global &body=http%3a%2f%2fstage.www.spglobal.com%2fmarketintelligence%2fen%2fmi%2fresearch-analysis%2fcorporate-bond-pricing-data-may-2019-recap.html","enabled":true},{"name":"whatsapp","url":"https://api.whatsapp.com/send?text=Corporate+Bond+Pricing+Data%2c+May+2019+Recap+%7c+S%26P+Global+ http%3a%2f%2fstage.www.spglobal.com%2fmarketintelligence%2fen%2fmi%2fresearch-analysis%2fcorporate-bond-pricing-data-may-2019-recap.html","enabled":true}]}, {"name":"rtt","enabled":true,"mobdesc":"Top"}
]}


