Customer Logins
Obtain the data you need to make the most informed decisions by accessing our extensive portfolio of information, analytics, and expertise. Sign in to the product or service center of your choice.
Customer Logins
BLOG
Sep 28, 2018
Falling demand for US equity "specials"
- Most expensive to borrow have underperformed by 170bps in September
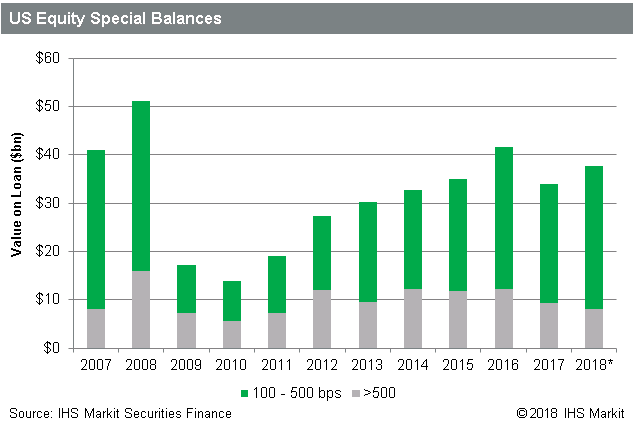
- US equity borrow balances with fees greater than 500bps down 34% since 2016
- Proliferation of low balance specials leads tor record number of specials
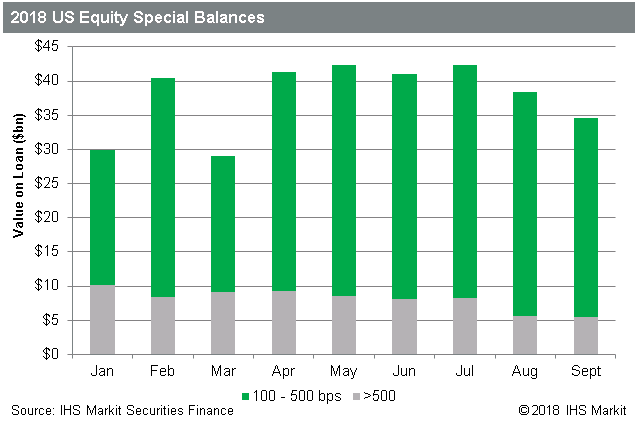
- Tesla bolsters "warm" balances back to 2016 peak
In a year which has generally been regarded as one big short squeeze, it's unsurprising that demand for the most expensive to borrow equities has been declining. The traditional short interest metric, which looks at the percentage of outstanding shares short, has delivered negative alpha this year, with the most shorted stocks outperforming the least shorted by 85bps per month, which doesn't even consider borrowing cost.
On the topic of borrow fees, the most expensive to borrow metric has actually fared better than other short interest related factors in 2018. September is on pace to be the fifth consecutive month of positive returns per IHS Markit Research Signals quant research platform, with the most expensive to borrow stocks underperforming the rest of US equities by more than 170bps MTD. That does not include borrow fees, however the average borrow fee for the most expensive to borrow group is currently 11% annualized, or 90bps per month, suggesting there has been alpha in the most expensive to borrow stocks in September, net of borrow fees.

The declining demand for specials in 2018 has extended a trend in place since 2016, when the Q2 rally jolted short sellers who added to positions in the Energy related sell-off in Q1. January 2016 was the best month for the most expensive to borrow factor post-crisis, followed shortly thereafter by April of that year turning in the worst post-crisis returns, and both records still stand.

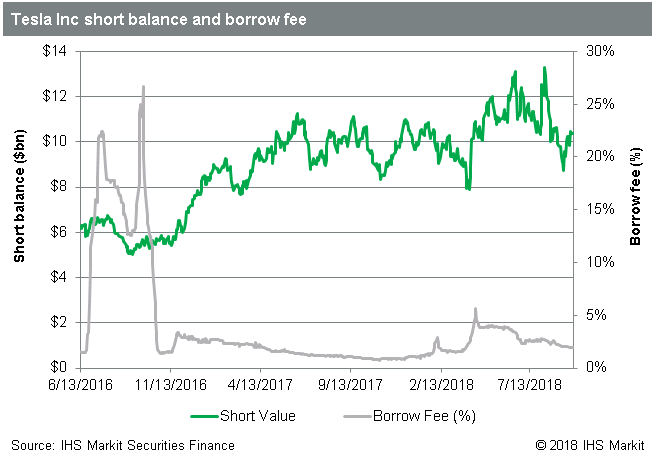
The "specials" balances in latter 2016 were aided by Tesla trading special around the Solarcity acquisition, which peaked on September 23rd, with borrow fees north of 27% on a balance of $5.4bn (the marginal rate for new borrows was 70% that day). While Tesla no longer trades special - minor shocks around proxy votes earlier this year notwithstanding - the fee has stayed above 100bps since April, bolstering the "warm" balances in the 100-500bps range.

The significance of Tesla to demand for "warm" stocks is notable, with balances in January and February much lower than March of this year, purely as the result of the Tesla balance being below the threshold. A similar story emerges for 2017, which had a TSLA sized hole for warm balances. It's worth noting that TSLA balances have only briefly touched a balance lower than $8bn since the borrow fee started to decline in early 2017.
Whether the recent alpha delivered by shorting the most expensive to borrow stocks leads to an increase in demand for specials remains to be seen. A further potential tailwind for specials demand is that October has historically been a strong month for returns to shorting the most expensive to borrow stocks. The most expensive to borrow US equities returned 4.9% less than the least expensive to borrow stocks in October 2017, which followed an even stronger October 2016, when the most expensive to borrow stocks underperformed by 5.5%. Amid a challenging year for short sellers, seeing the most expensive borrows in the short book deliver alpha, net of borrow cost, is certainly welcomed for as long as it lasts.
S&P Global provides industry-leading data, software and technology platforms and managed services to tackle some of the most difficult challenges in financial markets. We help our customers better understand complicated markets, reduce risk, operate more efficiently and comply with financial regulation.
This article was published by S&P Global Market Intelligence and not by S&P Global Ratings, which is a separately managed division of S&P Global.
{"items" : [
{"name":"share","enabled":true,"desc":"<strong>Share</strong>","mobdesc":"Share","options":[ {"name":"facebook","url":"https://www.facebook.com/sharer.php?u=http%3a%2f%2fstage.www.spglobal.com%2fmarketintelligence%2fen%2fmi%2fresearch-analysis%2ffalling-demand-for-us-equity-specials.html","enabled":true},{"name":"twitter","url":"https://twitter.com/intent/tweet?url=http%3a%2f%2fstage.www.spglobal.com%2fmarketintelligence%2fen%2fmi%2fresearch-analysis%2ffalling-demand-for-us-equity-specials.html&text=Falling+demand+for+US+equity+%22specials%22+%7c+S%26P+Global+","enabled":true},{"name":"linkedin","url":"https://www.linkedin.com/sharing/share-offsite/?url=http%3a%2f%2fstage.www.spglobal.com%2fmarketintelligence%2fen%2fmi%2fresearch-analysis%2ffalling-demand-for-us-equity-specials.html","enabled":true},{"name":"email","url":"?subject=Falling demand for US equity "specials" | S&P Global &body=http%3a%2f%2fstage.www.spglobal.com%2fmarketintelligence%2fen%2fmi%2fresearch-analysis%2ffalling-demand-for-us-equity-specials.html","enabled":true},{"name":"whatsapp","url":"https://api.whatsapp.com/send?text=Falling+demand+for+US+equity+%22specials%22+%7c+S%26P+Global+ http%3a%2f%2fstage.www.spglobal.com%2fmarketintelligence%2fen%2fmi%2fresearch-analysis%2ffalling-demand-for-us-equity-specials.html","enabled":true}]}, {"name":"rtt","enabled":true,"mobdesc":"Top"}
]}


