Customer Logins
Obtain the data you need to make the most informed decisions by accessing our extensive portfolio of information, analytics, and expertise. Sign in to the product or service center of your choice.
Customer Logins
ECONOMICS COMMENTARY
Nov 19, 2024
How to interpret and use the Productivity PMI
Please click here for the full report
The Productivity PMI from S&P Global Market Intelligence is a measure of labour efficiency and therefore a key determinant of corporate profitability, earnings growth, and overall economic performance. Based on individual company productivity scores, the index provides accurate monthly productivity insights for comparison across economies.
What does the Productivity PMI measure?
The Productivity PMI is a performance gauge measuring the efficiency of labour inputs, tracking changes in output relative to changes in the amount of labour employed. The series is based on monthly survey responses provided by companies in relation to output and employment for the PMI data compiled by S&P Global Market Intelligence.
How is the Productivity PMI complied?
The Productivity Index is based on company-level responses from representative national manufacturing and service sector panels. Companies are asked if their output and employment levels are the same, higher, or lower than in the prior month:
Please compare the volume of output produced (level of business activity) this month compared to one month ago. (manufacturing/services)
Please compare your employment level this month compared to one month ago.
A productivity score is then calculated for each respondent, where the highest score is awarded to firms that have increased their output level (on the month) and also reduced their employment numbers. The lowest score is accorded to firms that cut output but raised employment (see matrix).
Table 1. Productivity Index Score
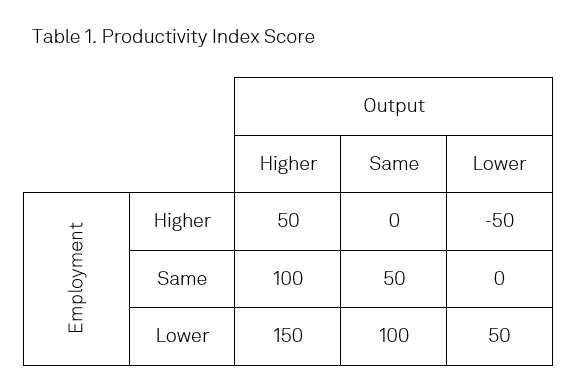
Individual scores are then aggregated to create the productivity index for a national sector, which is then adjusted to remove any expected seasonal variations. The series is then smoothed using a three-month moving average to produce a less volatile series and better signpost changing productivity trends. An overall productivity figure is calculated for each country by weighting the adjusted, smoothed manufacturing and services data by each sectors gross value added (GVA).
Why does productivity matter?
Put simply, a more productive company can raise output without increasing either labour or capital inputs, but rather by improving the efficiency of the production process. Such a focus on productive efficiency has noticeable benefits to a company principally by reducing the unit cost of production - and with that the profitability of the firm. This is also an important concept at the wider economy-level. Higher productivity implies an increase in economic output (or income) per capita and with that a rise in living standards.
Economists focus on the productive efficiency of both capital (i.e. machinery, buildings etc) and labour (i.e. workers). This is sometimes referred to as total-factor productivity. To be clear, as the Productivity PMI is centred around two diffusion indices, output and employment our focus is on labour productivity. A value greater than 50.0, implies improved workforce efficiency, whereas a sub-50.0 reading would imply a deterioration in labour efficiency.
How accurate is the Productivity PMI?
The Productivity PMI provides up to date monthly insights into firms' labour productivity, making the series advantageous over official data from a timing perspective. Official data typically rely on the implied relationship between output and employment and is calculated using country or sector-level aggregates, for example Gross Domestic Product (GDP) or Gross Value Added (GVA) divided by hours worked. Estimates are usually published with a noticeable delay or lag and/or are less frequent.
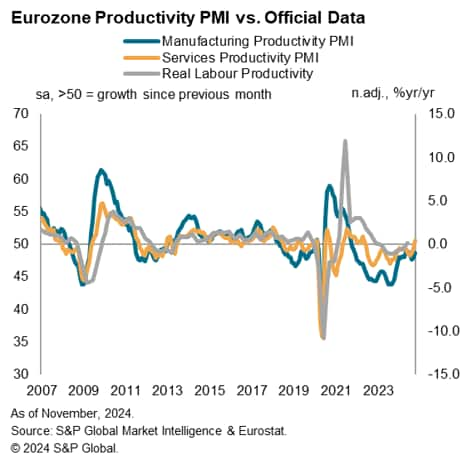
Figure 1. shows the trend for manufacturing and services Eurozone Productivity PMI closely tracking that of official data relating to labour productivity.
Figure 1.
How can the Productivity PMI be used?
Corporate earnings insights
Given that the PMI surveys are private sector focused, the data perform well in indicating changes in corporate performance. At the company-level, the ability to increase output without raising per unit costs will have a positive impact on profits.
Figure 2.
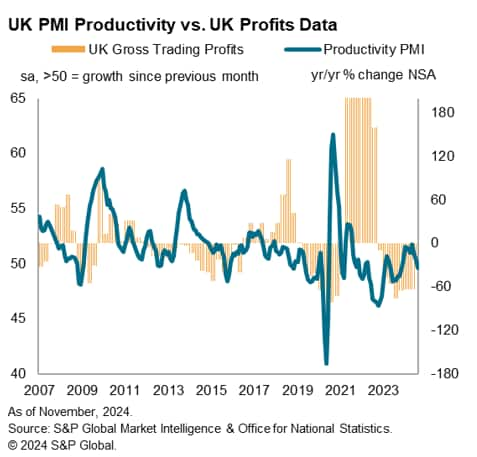
With this in mind, there can be a positive association between the Productivity PMI and corporate earnings data. Figure 2 shows the UK Productivity PMI tracking the peaks and troughs of gross trading profits (UK private non-financial corporations).
Price pressures and inflation
Improvements in productivity can increase an economy's supply capacity, determined by the level of output that is able to be produced by the quantity of labour available . A greater supply capacity allows for greater output, without additional inflationary pressures.
Users therefore may find it useful to consider the Productivity PMI data alongside complementary capacity utilisation and orders-to-inventories data from S&P Global, to help form an assessment of private sector spare capacity and guide their forecasts for inflation.
Business cycle identification
Understanding productivity trends can help users monitor cyclical changes and identify an economy's position in the business cycle. For instance, in a period of recession output falls before employment, as firms' first response to weak demand is to reduce output, while decisions on labour usage follow later.
Figure 3.
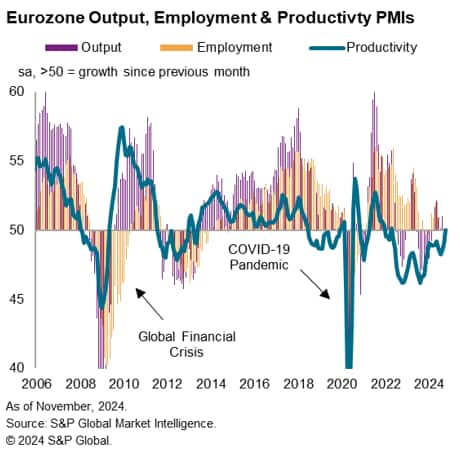
More recently, productivity trends during and post-pandemic varied from country to country due to the differing severity of COVID-19 related lockdown measures and various levels of government support. Job retention schemes or short-time work schemes adopted (or enhanced) across several eurozone countries aimed to save jobs by keeping the relationship between employer and employee intact for instance. Labour mobility was reduced, labour hoarding increased and as the decline in output outpaced employment , productivity fell (see figure 3).
Comparability
Use cases include benchmarking against sector or national performance, where companies can use the PMI data alongside their own productivity data, based on output and headcounts data. This comparison can help firms identify areas of improvement, set regular and realistic performance targets due to the data's timeliness, as well as make investment decisions surrounding training and technology.
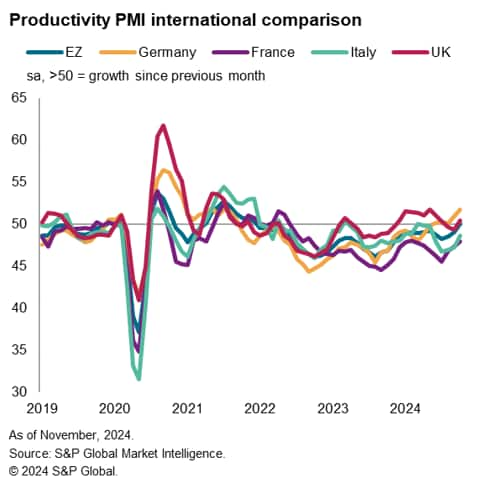
As the data are collected using a standardised methodology, international comparisons can be made and provide insights into the competitiveness of a country. Countries able to produce more with less labour tend to generate more profits but are also less likely to raise prices compared to less productive countries. Greater price competitiveness makes exports more attractive as they are comparatively cheaper, all things equal. In addition, as productivity gains increase the supply of a good or service, real prices decrease, leading to an uplift in real wages and an improvement in living standards.
Figure 4.
Summary
The Productivity PMI is a derived indicator that complements S&P Global's country level and regional PMI datasets. As shown above, the Productivity PMI can be applied to a wide variety of use cases, with its value in part stemming from its timely nature and monthly frequency. Notably, the Productivity PMI also provides real insights into firm-level productivity trends, rather than relying on implied relationships, which helps to form a more accurate picture of productivity trends in both the short- and long-run.
Presently the data are only available for major European economies, but there is scope - and plans underway - to produce series for the 40+ geographies covered by the PMI surveys, regional groupings, or even narrower sectors.
What are the advantages of the PMI series?
The PMI series provide an advance signal of what is happening in the private sector economy and are advantageous for the following reasons:
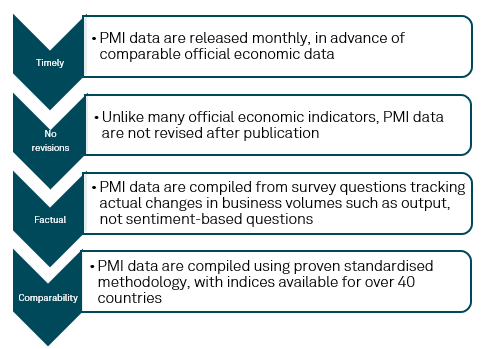
As data are collected mid-month and released at the start of the following reference period, they are often available well-ahead of official statistics and are not revised after publication. Panels are constructed to represent the economy and the survey questions are designed to track actual changes in variables (not sentiment-based). At present, productivity data are available for the following countries and regions at the manufacturing, services and composite levels:
- European Union
- Eurozone
- France
- Germany
- Italy
- United Kingdom
Productivity PMI release date
- Productivity PMI data is made available to subscribers on the fourth working day of the month at 0930 UK time.
Eleanor Dennison, Economist, S&P Global Market Intelligence
Tel: +44 1344 328 197
Email: eleanor.dennison@spglobal.com
© 2024, S&P Global. All rights reserved. Reproduction in whole
or in part without permission is prohibited.
Purchasing Managers' Index™ (PMI®) data are compiled by S&P Global for more than 40 economies worldwide. The monthly data are derived from surveys of senior executives at private sector companies, and are available only via subscription. The PMI dataset features a headline number, which indicates the overall health of an economy, and sub-indices, which provide insights into other key economic drivers such as GDP, inflation, exports, capacity utilization, employment and inventories. The PMI data are used by financial and corporate professionals to better understand where economies and markets are headed, and to uncover opportunities.
This article was published by S&P Global Market Intelligence and not by S&P Global Ratings, which is a separately managed division of S&P Global.
{"items" : [
{"name":"share","enabled":true,"desc":"<strong>Share</strong>","mobdesc":"Share","options":[ {"name":"facebook","url":"https://www.facebook.com/sharer.php?u=http%3a%2f%2fstage.www.spglobal.com%2fmarketintelligence%2fen%2fmi%2fresearch-analysis%2fhow-to-interpret-and-use-the-productivity-pmi-Nov24.html","enabled":true},{"name":"twitter","url":"https://twitter.com/intent/tweet?url=http%3a%2f%2fstage.www.spglobal.com%2fmarketintelligence%2fen%2fmi%2fresearch-analysis%2fhow-to-interpret-and-use-the-productivity-pmi-Nov24.html&text=How+to+interpret+and+use+the+Productivity+PMI+%7c+S%26P+Global+","enabled":true},{"name":"linkedin","url":"https://www.linkedin.com/sharing/share-offsite/?url=http%3a%2f%2fstage.www.spglobal.com%2fmarketintelligence%2fen%2fmi%2fresearch-analysis%2fhow-to-interpret-and-use-the-productivity-pmi-Nov24.html","enabled":true},{"name":"email","url":"?subject=How to interpret and use the Productivity PMI | S&P Global &body=http%3a%2f%2fstage.www.spglobal.com%2fmarketintelligence%2fen%2fmi%2fresearch-analysis%2fhow-to-interpret-and-use-the-productivity-pmi-Nov24.html","enabled":true},{"name":"whatsapp","url":"https://api.whatsapp.com/send?text=How+to+interpret+and+use+the+Productivity+PMI+%7c+S%26P+Global+ http%3a%2f%2fstage.www.spglobal.com%2fmarketintelligence%2fen%2fmi%2fresearch-analysis%2fhow-to-interpret-and-use-the-productivity-pmi-Nov24.html","enabled":true}]}, {"name":"rtt","enabled":true,"mobdesc":"Top"}
]}


