Customer Logins
Obtain the data you need to make the most informed decisions by accessing our extensive portfolio of information, analytics, and expertise. Sign in to the product or service center of your choice.
Customer Logins
EQUITIES COMMENTARY
Sep 10, 2021
Securities Finance August 2021 Snaphsot
- August revenues increased by 38% YoY
- APAC equity revenue rebound in-tact
- All-time high monthly revenue for Taiwanese market
- ETP & ADR borrow demand remains robust
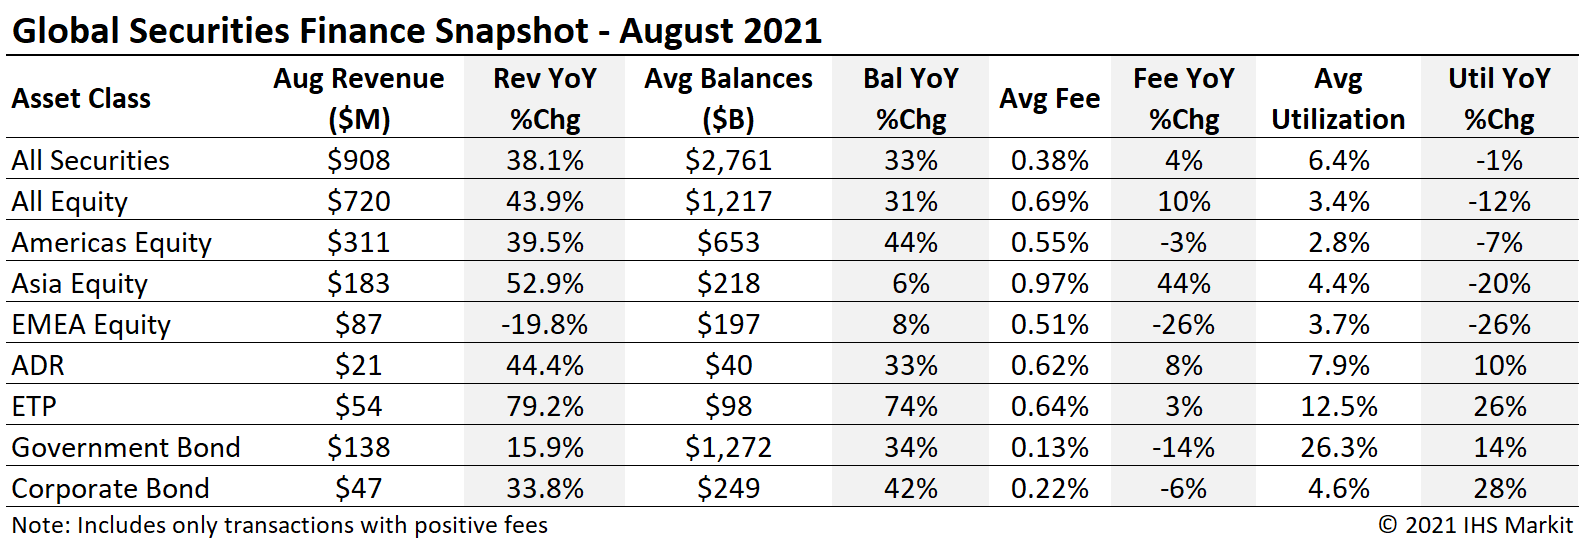
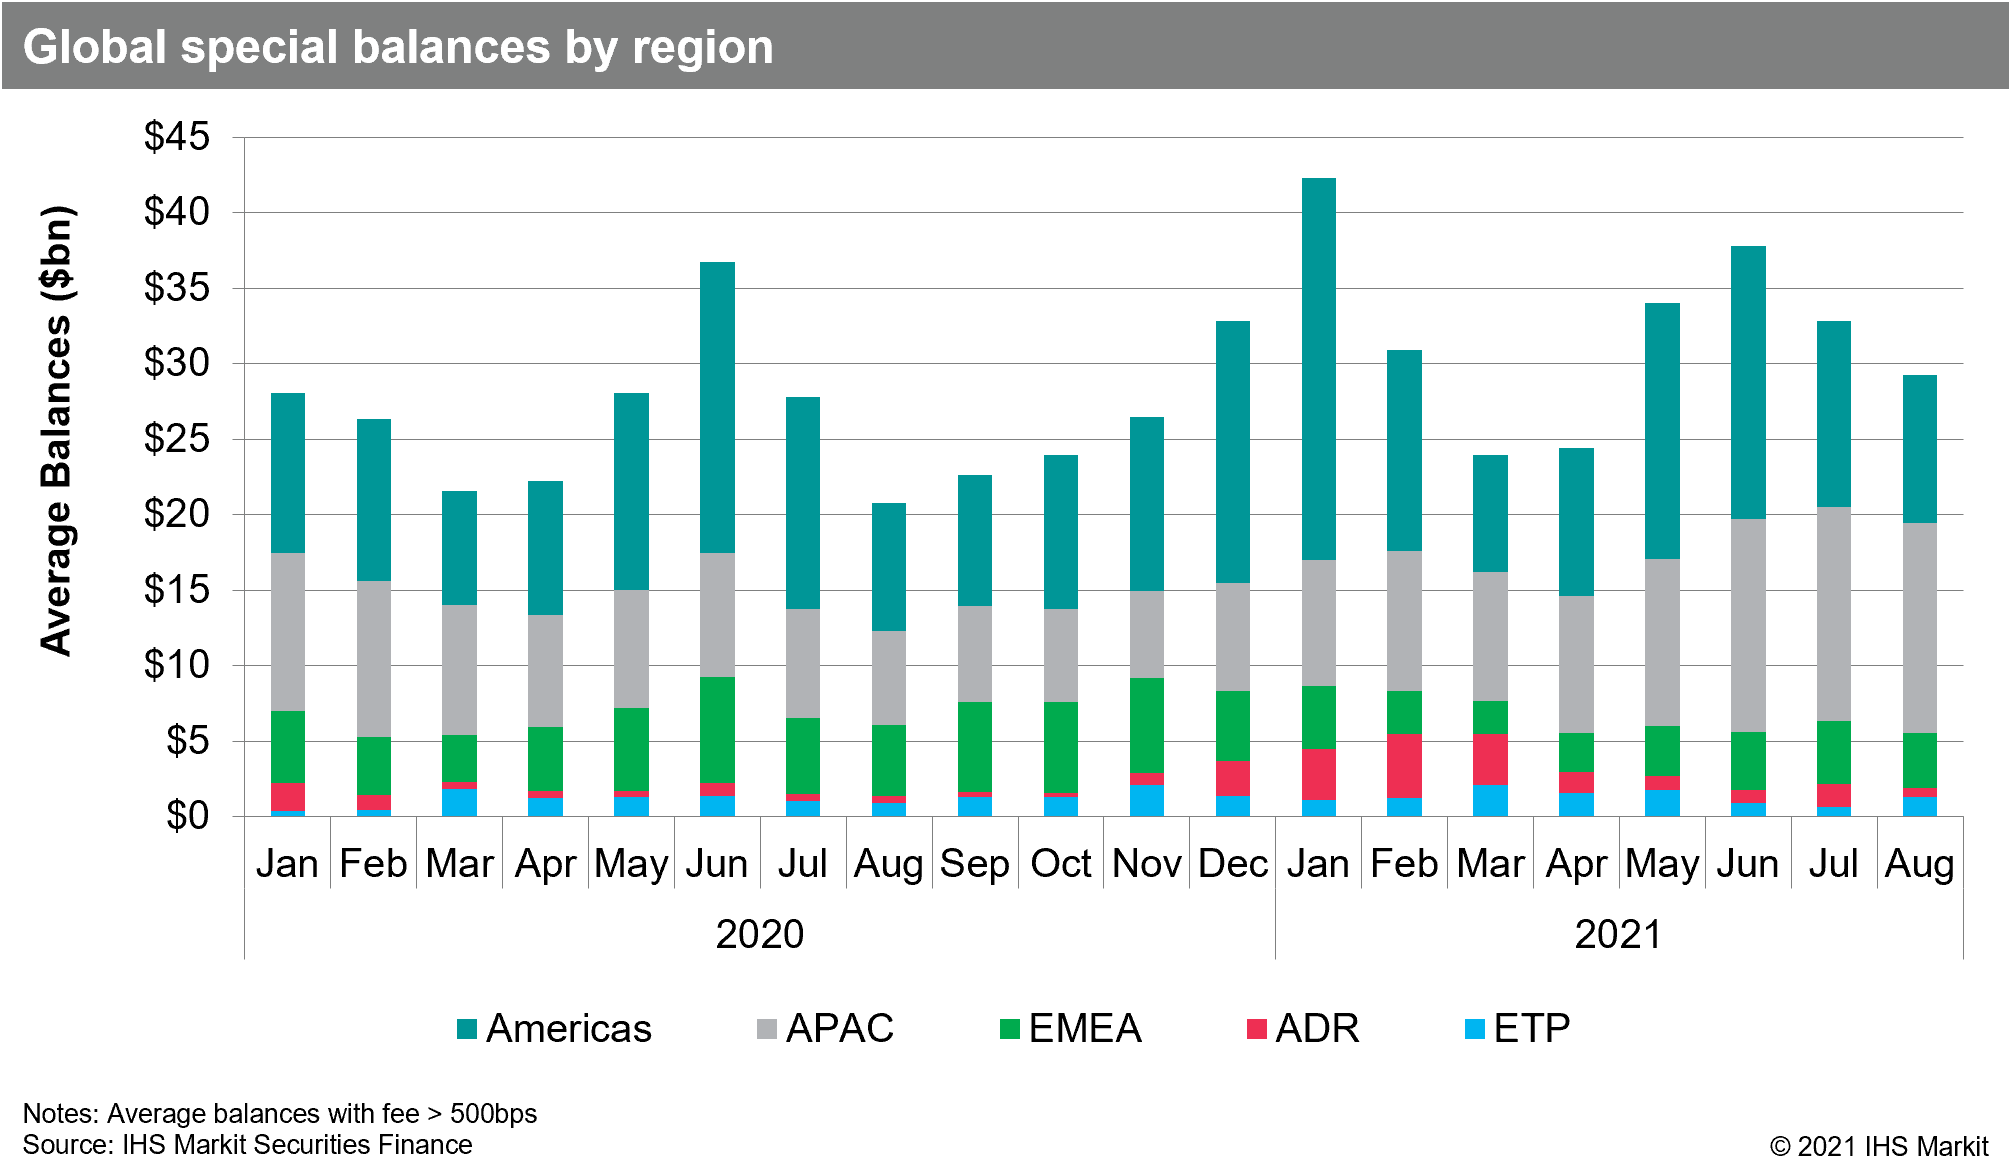
Global securities finance revenues totaled just over $900m in August, a 38% YoY increase. August is typically a quiet month for capital markets activity, however, a number of demand drivers supported the YoY revenue growth. Global equity special balances, defined in this note as balances with a fee greater than 500bps, declined by 10% MoM, however balances with a fee greater than 2,000bps increased by 35%. The general uptrend in borrow demand for APAC equities, global ETFs and ADRs remained in-tact in August, while a few specials boosted returns for US equity lenders. In this note we'll review some drivers of global securities finance returns for August.
APAC Equity
APAC equity finance revenues increased by 53% YoY in August, with $183m in monthly revenue. The August return was very similar to July, with revenues declining 0.5% MoM. APAC equity special balances declined by 2.5% MoM, following four consecutive months of MoM increases. June's $13.8bn in daily average special balances is the third highest monthly average for 2021, trailing only June and July, so the broad uptrend in special balances remains in-tact. Special balances are defined in this note as balances with a fee greater than 500bps.
Increasing borrow demand for Taiwan equities boosted equity finance revenues to $53m in August, a 239% YoY increase and the most monthly revenue on record for that market. The upswing in lending revenues for the Taiwan market in July and August has been driven by increasing balances for hard to borrow shares. Four of the top 10 most revenue generating equities in APAC in August were listed in Taiwan. Utilization of Taiwanese equities increased by 62% YoY, with increasing loan balances sufficient to offset a 34% increase in lendable assets.
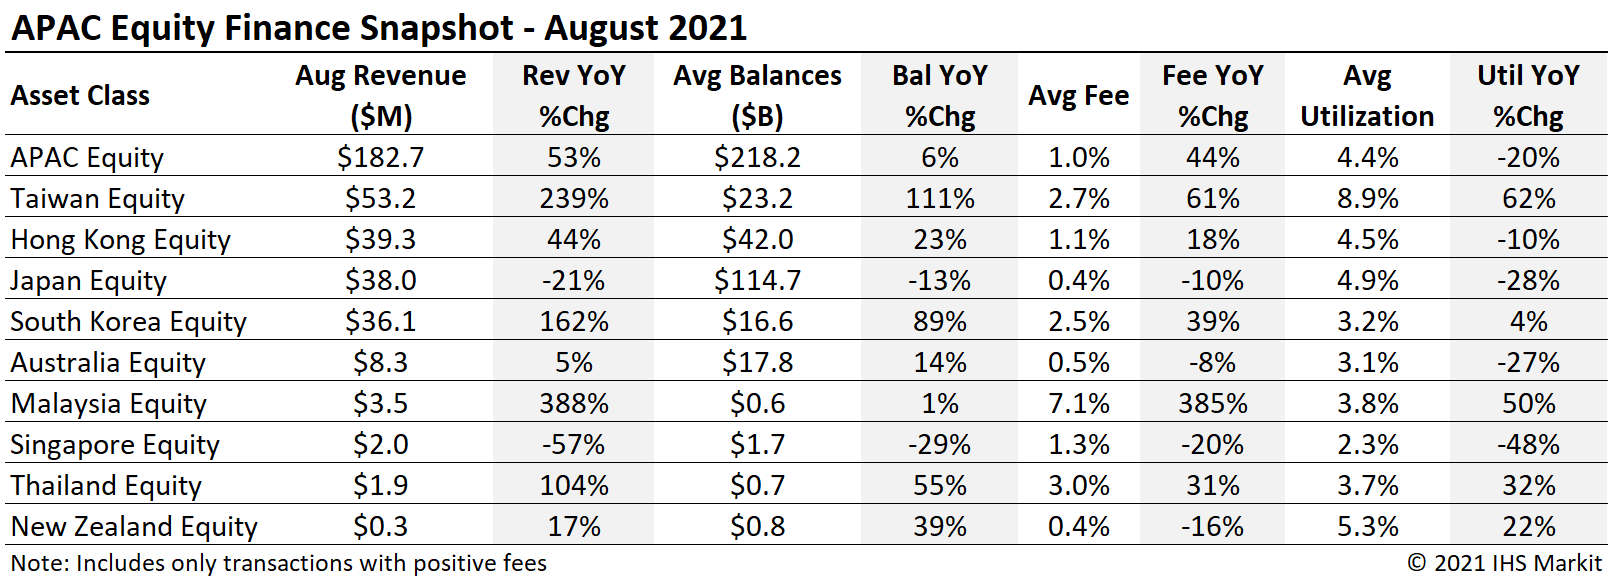
Hong Kong SAR equity finance revenues increased by 44% YoY in August; however, that was not enough to keep the title as most revenue generating equity market in APAC, with Taiwan pulling ahead. Most equity finance metrics showed YoY growth for the HK market, though lendable assets grew by more than loan balances causing utilization to decline. The most revenue generating HK equity was China Evergrande Group, which generated $5.8m in August revenue; the firm's debt has also seen increased borrow demand in recent months.

Japan equity finance revenues declined 21% YoY in August as a result of declining loan balances and fees. Japan only delivered one of the top twenty most revenue generating APAC equities, Seven & I Holdings Co Ltd.
South Korea equity revenue totaled $36m for June, a 162% YoY increase. Following a stellar July with just over $39m in revenue, SK equity finance revenues declined by 7.8% MoM in August.
Americas Equity
America's equity revenues came in at $311m for August, a 39.5% YoY increase. The YoY comparison is driven by particularly quiet August 2020, which delivered the least revenue for any month of 2020. The revenue uptick was not purely the result of a light YoY comparison, with average daily revenues growing 5% MoM as compared with July. America's average equity special balances declined by 20% MoM, with August having the lowest average since March when using 500bps as a cutoff for special balances. The MoM revenue growth was supported by an increase in balances with fees greater than 2,000bps. Taken together, America's equity special revenue was boosted by higher fees for the hardest to borrow shares despite an overall decline in special balances.
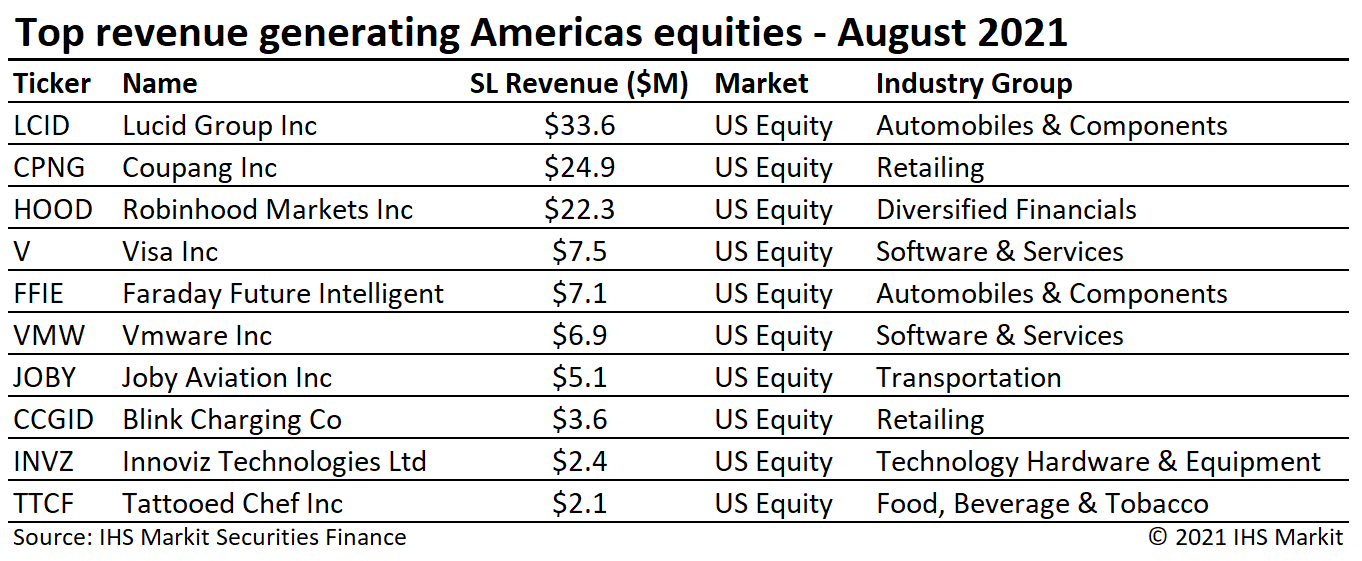
US equity revenues came in at $287m for August, a 46% YoY increase and a 3.4% MoM increase compared with July. The comparison with 2020 is stark, where August was the least revenue generating month of the year, seeing a 51% MoM decline compared with July of last year.
Canadian equity lending revenue of $23.4m reflected an 8.5% YoY decline for August. The YoY decline was driven by a 26% decline in average fees. Total Canadian equity loan balances averaged $45b in August, roughly equaling the average over prior five months, while specials balances averaged $553m, the lowest monthly average YTD.
European Equity
European equity returns decreased by 20% YoY for August, with $$86.5m in monthly revenue the lowest monthly return since February. The YoY decrease was driven by decreasing fees, with a sharp YoY shortfall in specials balances, particularly in Germany.
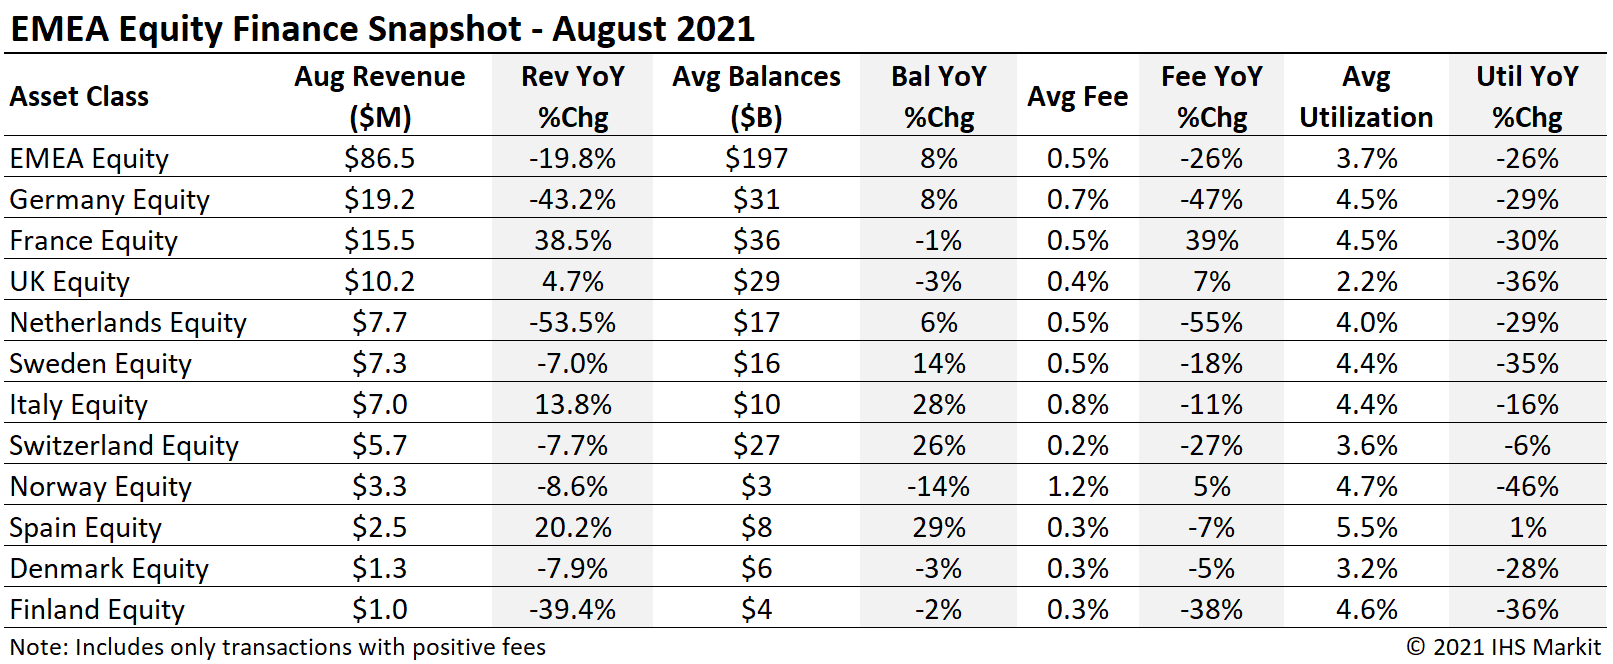
German equity revenues of $19.2m reflect a 43% YoY decline for August. The top two revenue generating German equities continue to be Deutsche Lufthansa and Varta Ag, with the former pulling ahead in August following near-matching returns for the pair in July.

France listed equity revenue increased 38.5% YoY. The upswing in revenues was partly the result of increasing specials balances, which boosted the overall average fee as well. UK equity revenues increased 4.7% YoY led by Tui Ag; shares for the travel and tourism firm are partly impacted by the convertible bond.
Depository Receipts
Revenues from lending American Depository Receipts (ADRs) increased 44% YoY, keeping the general YoY revenue uptrend on track despite August having the least revenue for any month YTD. ADR revenues declined by 43% MoM; part of the decline was driven by declining share prices and loan balances, particularly for Chinese ADRs. Excluding the impact of Chinese ADRs, revenues declined by 25% MoM. August average loan balances of $39.7m reflect a 33% YoY increase and a 19% MoM decline.

Exchange Traded Products
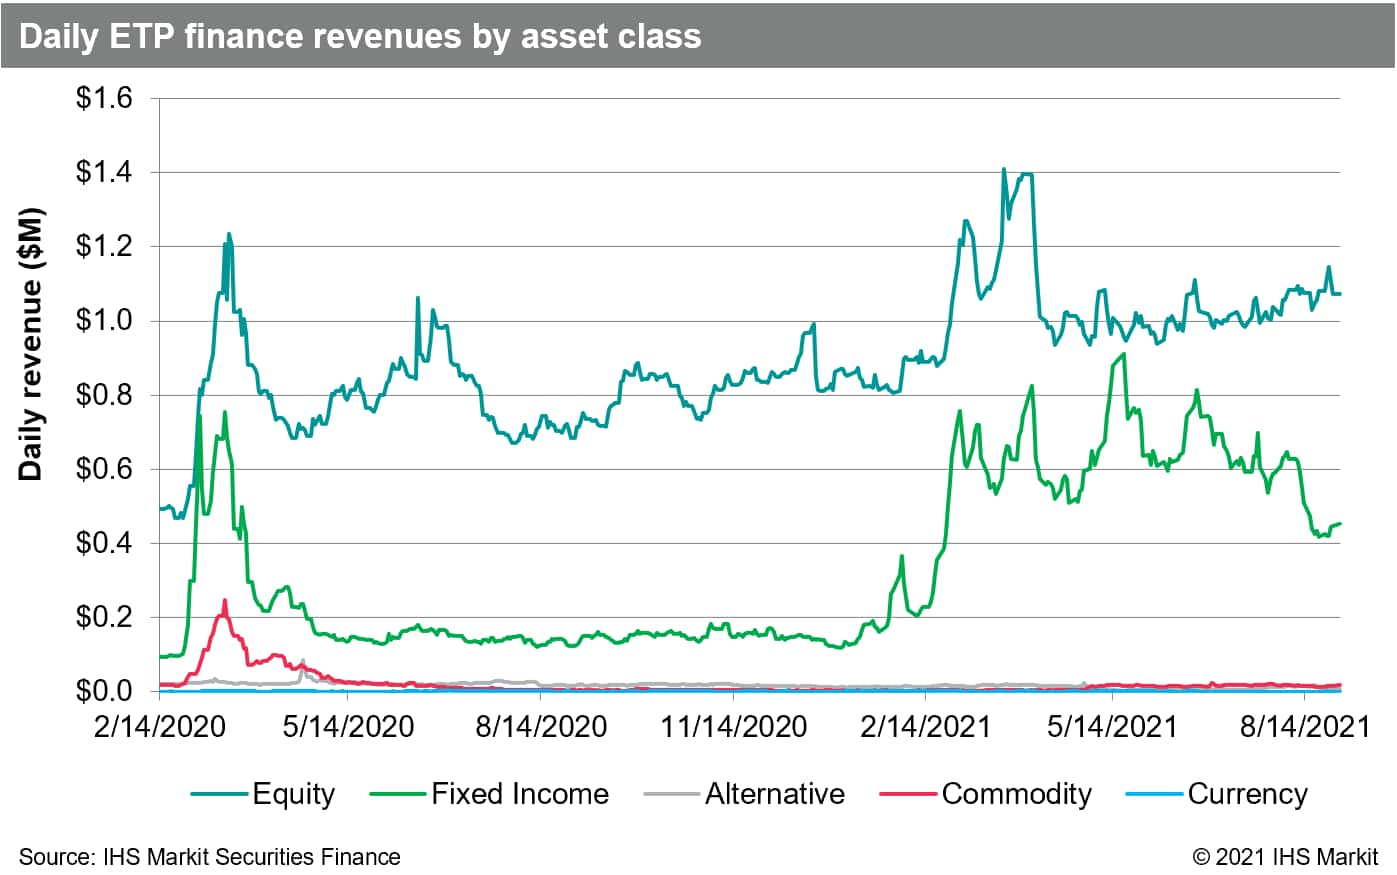
Global ETP revenues totaled $54m for August, a 55% YoY increase. Despite the strong YoY comparison, it's worth noting that revenues dipped 2.5% MoM as the result of marginal declines in average fees and loan balances. Lendable asset values set a new all-time monthly average high of $479bn; however, YoY loan balance growth has kept utilization well above 2020 levels since June. Revenues for fixed income products decreased 18% MoM. FI products generated 32% of August revenue, down from 37.5% in July. Revenues for equity products increased by 6% MoM. ETP specials balances doubled MoM to $1.3bn, with the largest contributor to the increasing demand for Harvest CSI 300 China A-Shares ETF (ASHR).

Corporate Bonds
Corporate bond lending delivered $47m in August revenue, an increase of 34% YoY and the most revenue for any month YTD. Corporate loan balances averaged $249b in August, an increase of 42% YoY and the largest monthly average balance YTD. Lendable assets have also steadily increased, reaching an all-time high at the end of August of $4.8T, though increasing loan balances were sufficient to drive a small uptick in utilization compared with July. Total corporate bond lending revenues for agency programs, including reinvestment returns and negative fee trades, increased by 7.4% YoY as the result of a 40% YoY increase in intrinsic fee income.

Government Bonds
Fee-spread revenues of global sovereign debt totaled $138m for August, a 15.9% YoY increase. Government bond borrow demand remains robust, with $1.27T in positive-fee global balances for August reflecting an 34% YoY increase. The $232bn increase in positive-fee balances is the result of a $154bn YoY increase in total on-loan balances along with $78bn moving from negative to positive fee. Total government bond lending revenues for agency programs, including reinvestment returns and negative fee trades, declined by 1% YoY as the result of narrower reinvestment spreads, with intrinsic fee revenue increasing by 22% YoY.

US government bond lending revenue came in at $74m for August, an 8.9% YoY increase, narrowly falling short of the July return. Returns from lending European sovereigns were $47m for August, a 16.5% YoY increase.
Conclusion
August is typically a quiet month for capital markets, however, some dynamic forces pushed against the seasonal impact for 2021. One tailwind for revenues all year has been the expirations of lock-up agreements for investors in IPOs and SPACs. Lock-up expiries continued to play a role in August as reflected on the leader board for US equity revenue generators. The usage of exchange traded products in institutional long portfolios and for short hedges continues to boost returns, though demand for some fixed income products has declined. Borrow demand for corporate bonds continues to increase with four consecutive months of YoY increases in intrinsic income. As the drivers of lending returns, which have been anticipated since the start of the year, continue to play out, along with some new themes, Q3 is on pace for a 13% YoY revenue increase.
Stay tuned for monthly revenue snapshots from IHS Markit Securities Finance!
S&P Global provides industry-leading data, software and technology platforms and managed services to tackle some of the most difficult challenges in financial markets. We help our customers better understand complicated markets, reduce risk, operate more efficiently and comply with financial regulation.
This article was published by S&P Global Market Intelligence and not by S&P Global Ratings, which is a separately managed division of S&P Global.
{"items" : [
{"name":"share","enabled":true,"desc":"<strong>Share</strong>","mobdesc":"Share","options":[ {"name":"facebook","url":"https://www.facebook.com/sharer.php?u=http%3a%2f%2fstage.www.spglobal.com%2fmarketintelligence%2fen%2fmi%2fresearch-analysis%2fsecurities-finance-august-2021-snaphsot.html","enabled":true},{"name":"twitter","url":"https://twitter.com/intent/tweet?url=http%3a%2f%2fstage.www.spglobal.com%2fmarketintelligence%2fen%2fmi%2fresearch-analysis%2fsecurities-finance-august-2021-snaphsot.html&text=Securities+Finance+August+2021+Snaphsot+%7c+S%26P+Global+","enabled":true},{"name":"linkedin","url":"https://www.linkedin.com/sharing/share-offsite/?url=http%3a%2f%2fstage.www.spglobal.com%2fmarketintelligence%2fen%2fmi%2fresearch-analysis%2fsecurities-finance-august-2021-snaphsot.html","enabled":true},{"name":"email","url":"?subject=Securities Finance August 2021 Snaphsot | S&P Global &body=http%3a%2f%2fstage.www.spglobal.com%2fmarketintelligence%2fen%2fmi%2fresearch-analysis%2fsecurities-finance-august-2021-snaphsot.html","enabled":true},{"name":"whatsapp","url":"https://api.whatsapp.com/send?text=Securities+Finance+August+2021+Snaphsot+%7c+S%26P+Global+ http%3a%2f%2fstage.www.spglobal.com%2fmarketintelligence%2fen%2fmi%2fresearch-analysis%2fsecurities-finance-august-2021-snaphsot.html","enabled":true}]}, {"name":"rtt","enabled":true,"mobdesc":"Top"}
]}


