Customer Logins
Obtain the data you need to make the most informed decisions by accessing our extensive portfolio of information, analytics, and expertise. Sign in to the product or service center of your choice.
Customer Logins
EQUITIES COMMENTARY
Aug 03, 2021
Securities Finance H1 2021 Review
- H1 revenues increase by 14% YoY
- APAC emerging markets ascendant
- US equity specials uneven returns
- Fixed income borrow demand uptrend
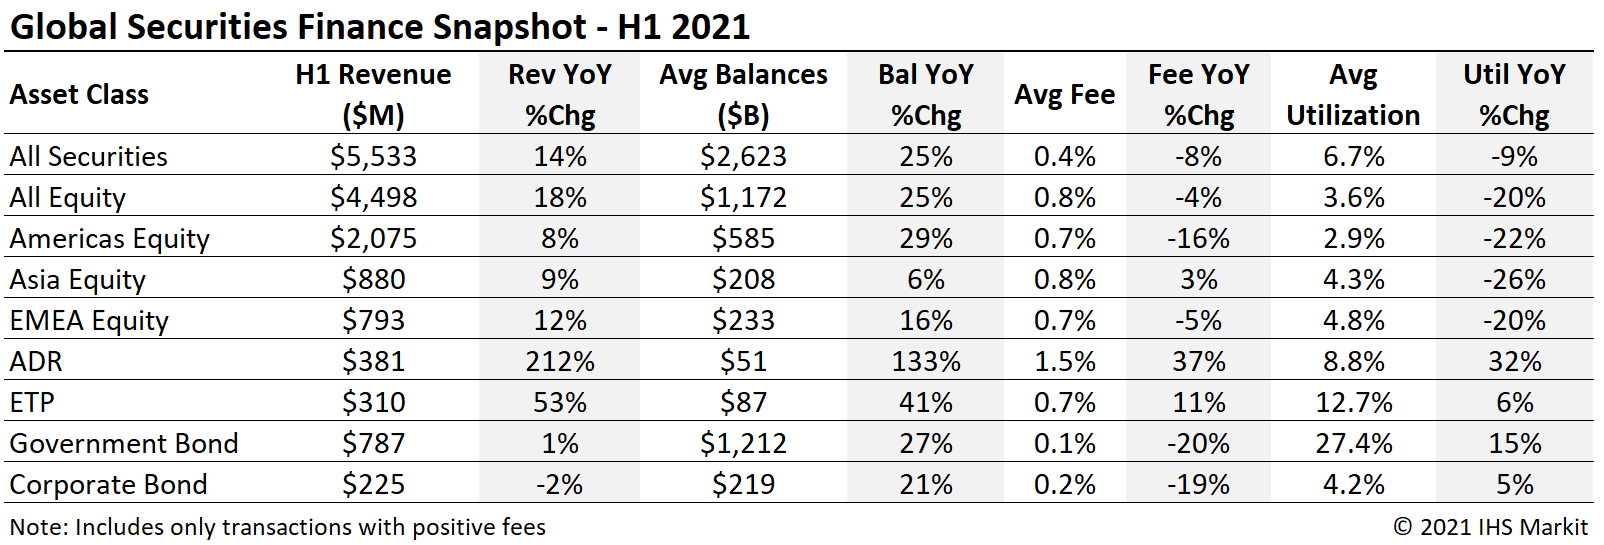
Global securities finance revenue surpassed $5.5b in the first half of 2021, an increase of 14% YoY. The YoY comparison with the first half of 2020 generally reflects increased balances and narrower fee spreads. Partly the comparison with H1 2020 is the result of lower equity values amid the COVID-related volatility. There are some significant exceptions including APAC equities, depository receipts and exchange traded products which all saw a YoY increase in average fees. US equity special balances varied widely in H1, while a lack of specials partially offset a recovery in EMEA equity finance revenues relating to dividend reinstatement. Fixed income returns from fee spreads were broadly like 2020 as a result of increased balances and narrower spreads, however reinvestment returns were much more like 2019 than the stellar return observed around the rate cuts in 2020.

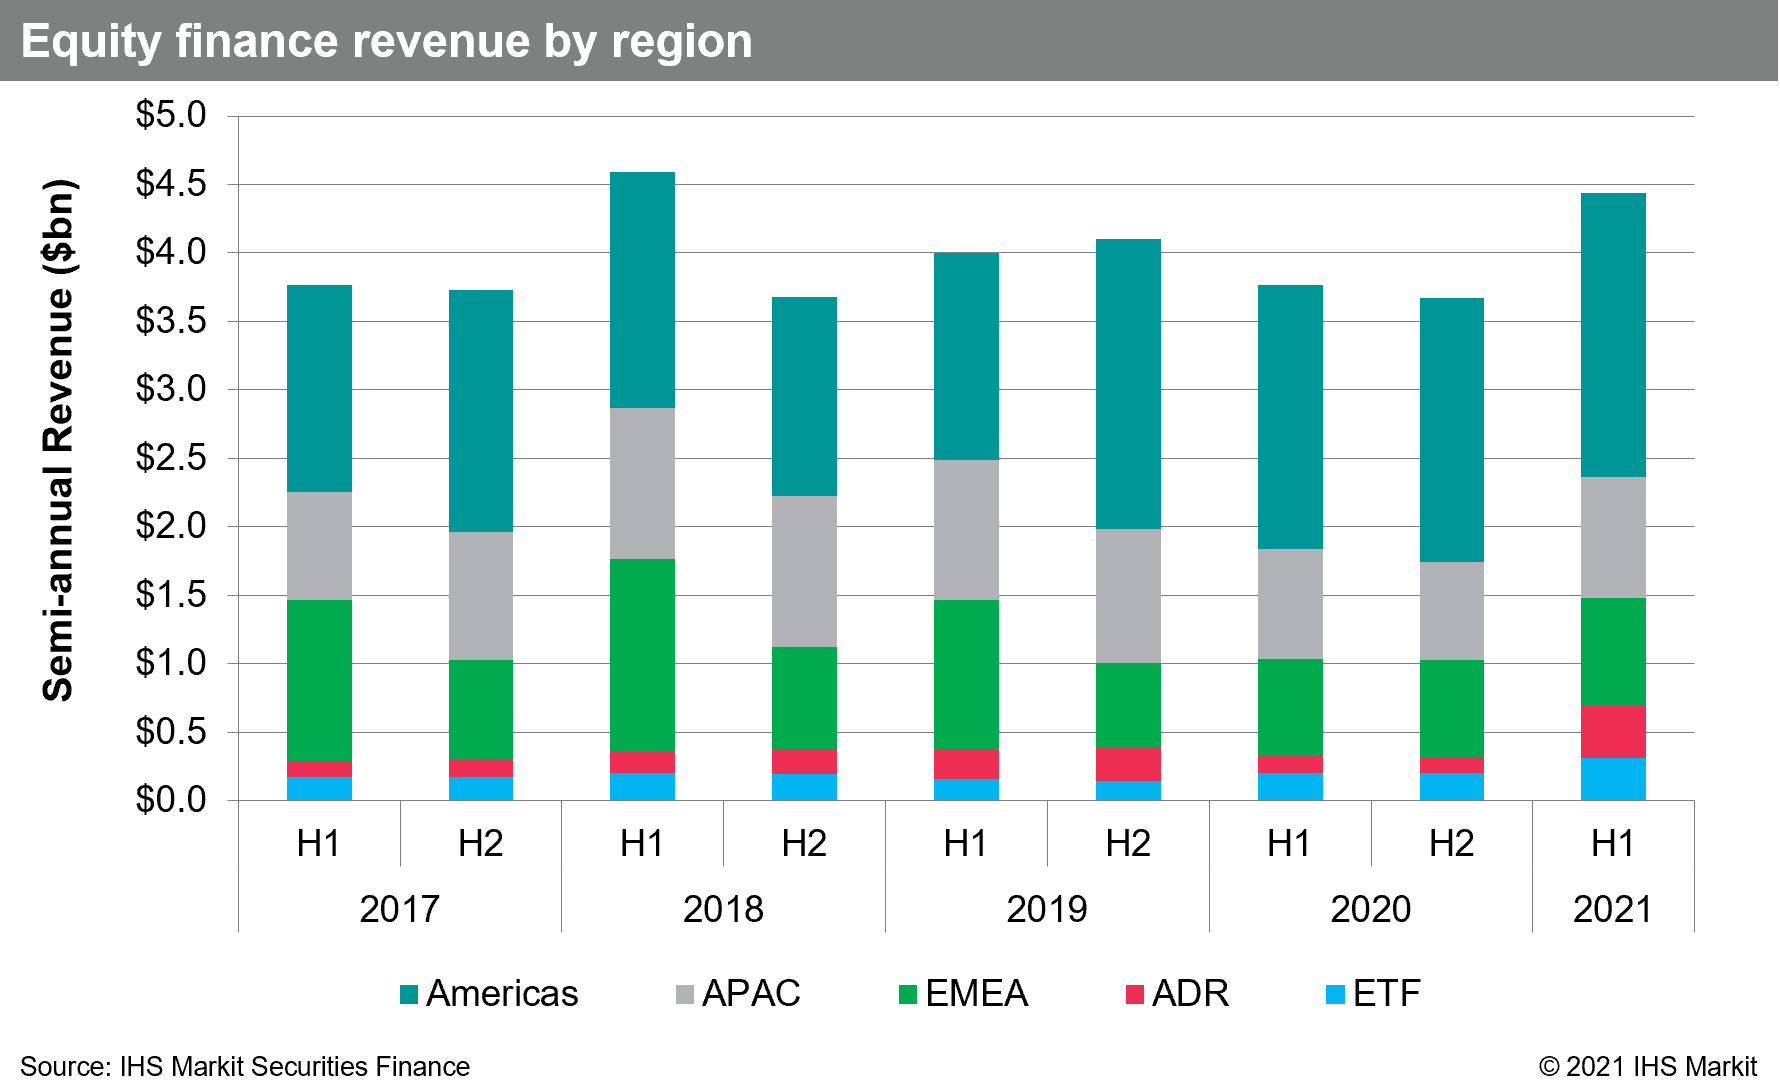
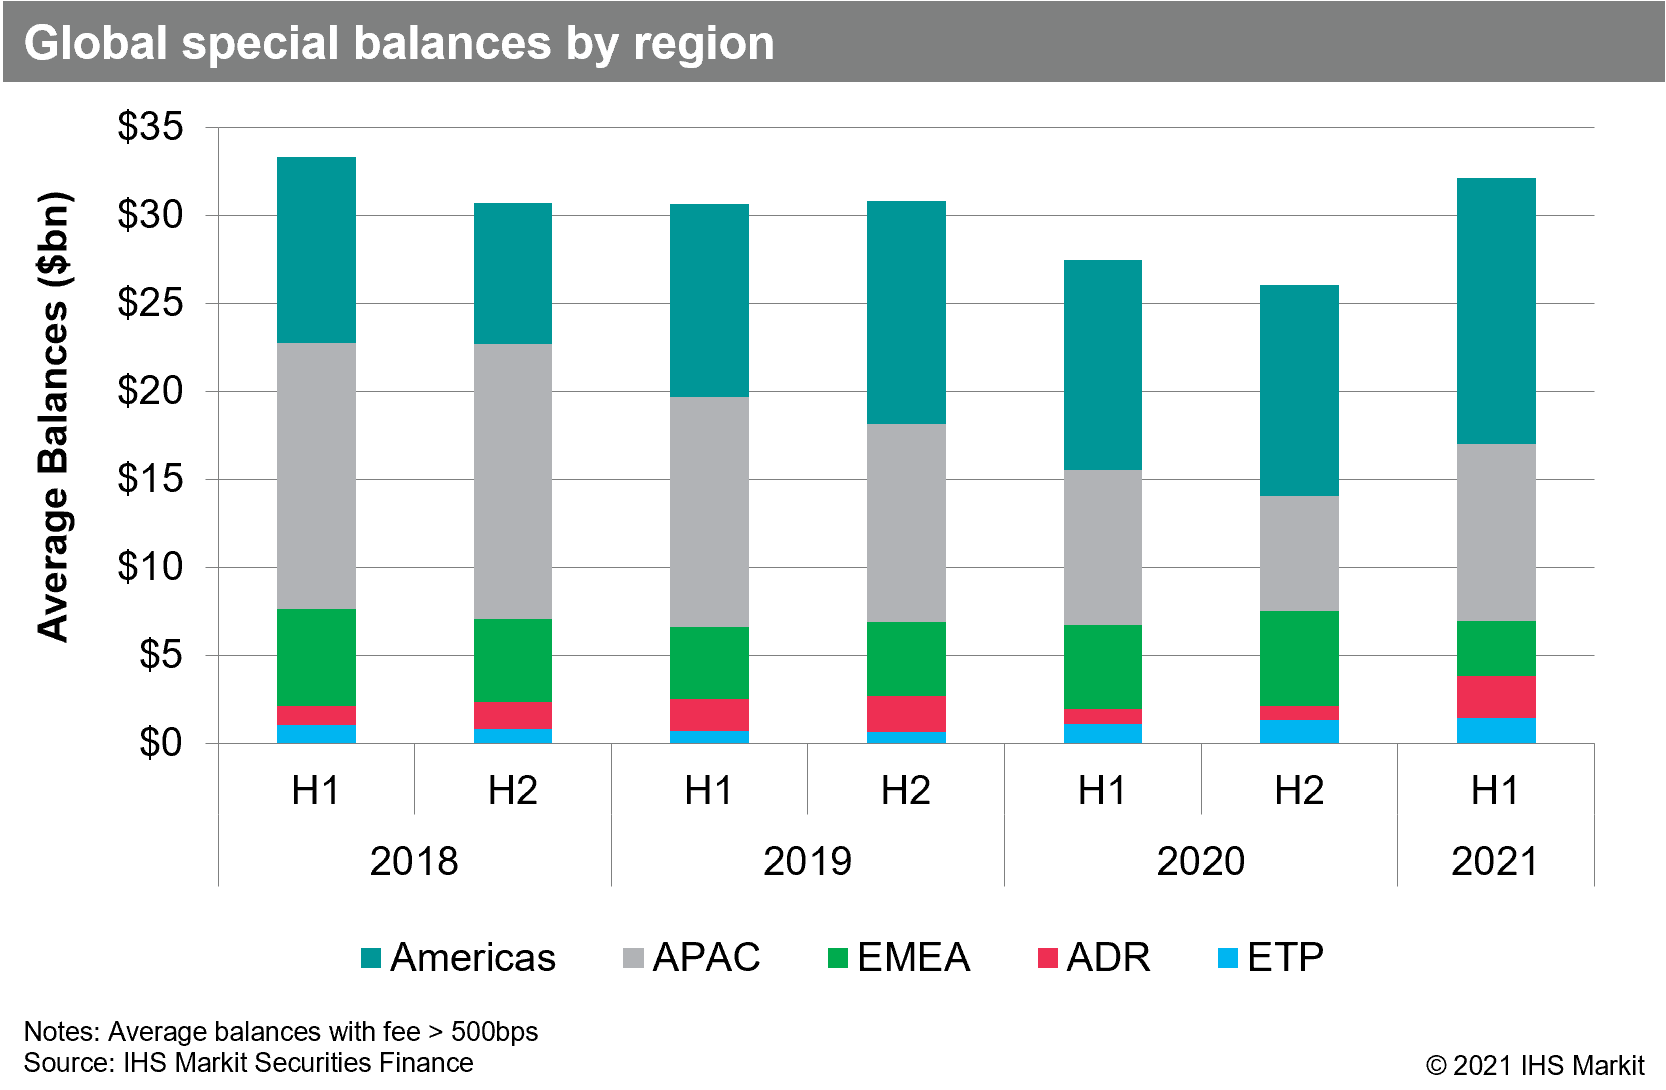
US equity revenues came in at $1.9bn for the first half of 2021, an increase of 16.5% YoY. The revenue increase was driven by a 28% YoY increase in loan balances, which more than offset the 9% reduction in average fees YTD. Nine percent of H1 US equity finance revenues were delivered by conventional IPOs which occurred in 2020, a slight reduction from the first half of 2020 when the 2019 class of IPOs delivered 9.7% of revenues. A starker YoY change was observed for US SPAC IPOs, where the 2020 class delivered 11% of H1 2021 revenues, where the 2019 class generated 0.1% of H1 2020 returns. Apart from borrow demand driven by IPOs around warrant redemptions and lockup expiries, the recurring broad squeezes in crowded US equity short positions have created lucrative lending opportunities. The squeeze at the end of January appeared at the time to be a coda to the outperformance of crowded shorts which started in April 2020, and the rest of Q1 was indeed rather subdued, however a few IPO/SPAC trades and another broad short squeeze in June saw US equity special balances resurgent toward the end of Q2.
Canadian equity lending revenues increased over the course of H1, but remain well below historical trend, largely the result of less Cannabis related loan balances. H1 revenues of $160m reflect a 44% YoY decline, the result of a 55% decline in average fees, despite a 27% YoY increase in loan balances.

Equity lending in Europe rebounded relative to 2020 but remained 27% below the 2019 level; H1 revenues of $793m reflect a 12% YoY increase. Part of the increase was due to reinstated dividends which boosted borrow demand, particularly for French equities, however the YoY comparison is complicated by some 2020 dividends which were delayed into July. EMEA equity specials, particularly in Germany, delivered substantial returns over the last half of 2020 however following the January short specials balances declined sharply; Q2 did see a pickup with stalwart contributors Varta Ag & Tui Ag seeing increased borrow demand.
Asia equity lending revenues have steadily trended higher from the 2020 low point in November, with the trend gaining momentum in Q2 after the short sale ban in South Korea was mostly lifted. H1 2021 revenues of $880m reflect an 8.7% YoY increase. Hong Kong SAR equity finance revenues have consistently shown YoY growth since May of 2020, producing 8 of the top 10 APAC revenue generators during H1. Taiwanese equity finance revenues increased steadily YTD, particularly in Q2, as special balances increased. Malaysia equity revenues surged largely on the back of Top Glove Corporation Bhd, the most revenue generating APAC security in H1. Australian equity revenues totalled $52m in H1, a 16% YoY increase.

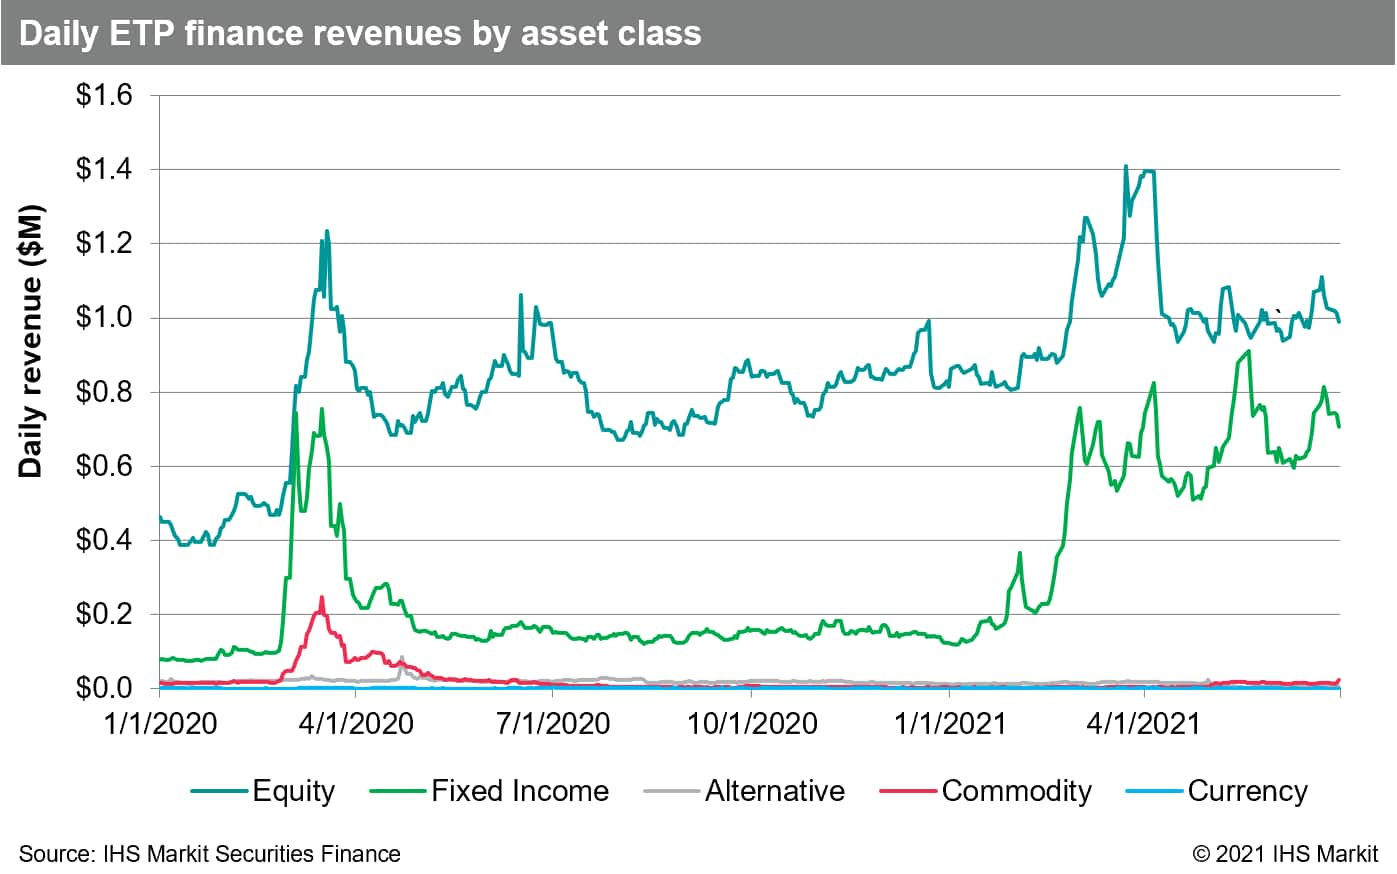
Global exchange traded product (ETP) revenues were $310m for H1, a 53% YoY increase. The stellar return had several drivers, the most notable was an increase in average fees for fixed income products. Fixed income products generated 34% of H1 returns, up from 22% in the first half of 2020. Ark Invest funds made a splash atop the most revenue generating product table with two funds amongst the top 10 for H1. Other products leading H1 revenue include emerging markets, particularly China-focused, and US equity indices. Products listed in the US generated $239m, an increase of 72% YoY, while non-US listed products generated $71m in H1, an increase of 12% YoY.

Depository receipts were an emergent asset class for lenders in H1, with surging fees for Hong Kong SAR firm Futu Holdings ADR listed on NASDAQ making it the most revenue generating security globally for H1 2021. Apart from Futu global depository, receipt revenues grew by 56% YoY, with the largest contributor being Chinese ADRs.
Fixed income lending via agency programs declined YoY as a result of lower returns on cash collateral generated, as compared with the period following the Q1 2020 interest rate cut. Total agency fixed income revenues declined by 14% YoY for H1 2021, the result of reinvestment revenue declining by 42% to $397m while fee spread revenue increased by 21% YoY, to $641m. The increase in revenue from lending fees is partly driven by a reduction in trades with negative intrinsic fee. For comparison, H1 2020 global fixed income agency lending revenues totalled $1.2b, the result of $678m of income from reinvestment of cash collateral and $530m in intrinsic spread income.
Total fee-based revenue for government bond lending came in at $787m for H1, a 1.2% YoY increase resulting from a 20% decline in average fees and a 27% increase in average on-loan balances. In Q1 some of the increased borrow demand for US Treasuries and investment grade credit was likely tied to trades regarding rate path and yield curve shape, which may have started to unwind in the 2nd quarter. US Treasuries returned $460m for H1, a 3.2% YoY decline. Canadian government debt returned $53.9m for H1, a 2.9% YoY increase. Returns from lending European sovereigns were $254m for H1, an 10% YoY increase, with Germany and France the largest contributors.
H1 corporate bond finance revenues came in at $225m, a 2.1% decline YoY. Loan balances steadily increased during H1 through May and trailed off a little in June; H1 average loan balances increased 21% YoY while average fees decreased by 19%. Part of the decrease in fees was the result of a lack of hard to borrow issues commanding additional return as compared with H1 2020. Revenues for investment grade corporates increased by 1% YoY, while revenues for non-investment grade and unrated corporates declined by 7% YoY.
Conclusion:
Global H1 revenues were the highest since 2018 on a variety of drivers including SPACs, squeezes, exchange traded products, ADRs and interest rate volatility. H1 was generally positive for global equity markets and financing activity relating to capital raising appear likely to persist into the second half of the year. APAC equity finance revenue has resurged after declining sharply amid short sale bans in 2020. Fixed income borrow demand is historically high, however interest rate declines may dent future borrow demand. Taken together, the drivers for equity borrow demand that were anticipated coming into 2021 are playing out, while some asset classes including ADR's and exchange traded products have exceeded expectations based on historical trends. While summer is often a slow period for capital markets, 2020 was particularly slow in August with a dearth of hard to borrow equities or corporate actions driving financing revenues; Following that slow period revenues increased steadily through Q4 for most asset classes globally. The 2nd half of 2021 has some compelling drivers at the outset including IPOs lockup expirations, the likelihood that many outstanding SPACs will seek business combinations, increasing borrow demand for EM APAC equities and historically high fixed income on-loan balances.
S&P Global provides industry-leading data, software and technology platforms and managed services to tackle some of the most difficult challenges in financial markets. We help our customers better understand complicated markets, reduce risk, operate more efficiently and comply with financial regulation.
This article was published by S&P Global Market Intelligence and not by S&P Global Ratings, which is a separately managed division of S&P Global.
{"items" : [
{"name":"share","enabled":true,"desc":"<strong>Share</strong>","mobdesc":"Share","options":[ {"name":"facebook","url":"https://www.facebook.com/sharer.php?u=http%3a%2f%2fstage.www.spglobal.com%2fmarketintelligence%2fen%2fmi%2fresearch-analysis%2fsecurities-finance-h1-2021-review.html","enabled":true},{"name":"twitter","url":"https://twitter.com/intent/tweet?url=http%3a%2f%2fstage.www.spglobal.com%2fmarketintelligence%2fen%2fmi%2fresearch-analysis%2fsecurities-finance-h1-2021-review.html&text=Securities+Finance+H1+2021+Review+%7c+S%26P+Global+","enabled":true},{"name":"linkedin","url":"https://www.linkedin.com/sharing/share-offsite/?url=http%3a%2f%2fstage.www.spglobal.com%2fmarketintelligence%2fen%2fmi%2fresearch-analysis%2fsecurities-finance-h1-2021-review.html","enabled":true},{"name":"email","url":"?subject=Securities Finance H1 2021 Review | S&P Global &body=http%3a%2f%2fstage.www.spglobal.com%2fmarketintelligence%2fen%2fmi%2fresearch-analysis%2fsecurities-finance-h1-2021-review.html","enabled":true},{"name":"whatsapp","url":"https://api.whatsapp.com/send?text=Securities+Finance+H1+2021+Review+%7c+S%26P+Global+ http%3a%2f%2fstage.www.spglobal.com%2fmarketintelligence%2fen%2fmi%2fresearch-analysis%2fsecurities-finance-h1-2021-review.html","enabled":true}]}, {"name":"rtt","enabled":true,"mobdesc":"Top"}
]}


