Customer Logins
Obtain the data you need to make the most informed decisions by accessing our extensive portfolio of information, analytics, and expertise. Sign in to the product or service center of your choice.
Customer Logins
EQUITIES COMMENTARY
Jun 08, 2022
Securities Finance May 2022 Snapshot
$1.162b in May securities finance revenue
- May revenues climb by 16% YoY
- Corporate bond borrow demand remains robust
- Slump in ADR borrow demand continues
- France & Germany lead EMEA upswing
Global securities finance revenues totaled $1.162b in May, a 16% YoY rise with most major categories showing YoY growth apart from ADRs and a YTD high. Average daily global revenues improved by 10% MoM compared with April. Year to date highs in revenue were seen in European equities and Corporate Bonds were driven by both YoY increases in balances and utilization. In this note, we will review the drivers of May revenue.

APAC Equity
APAC Equity Finance generated a total of $165m in May, up 11% YoY but down 7% MoM. Balances remained flat YoY but average fees (+12% YoY) and average utilization (+18% YoY) were both up leading to the increase in revenue. Taiwan equities lead the way with $48m generated in May off an increase of 35% YoY in average fees. Hong Kong equities delivered $37m in the month of May which was down 10% YoY but still the highest revenue generated YTD increasing 20% MoM. South Korea continues a MoM downtrend down another 9% in May but still up 39% YoY but showing a strong 6% utilization, up 120% YoY and 7% MoM.

Lg Energy Solution continues to hold the top spot for the third month in a row delivering $2.78m in May but average fees and borrow demand have decreased 33% and 20% MoM respectively. The rest of the top five was split between Taiwan securities Acer Inc ($1.91m), Novatek Micro ($1.51m) and Hong Kong securities Weimob Inc ($1.83m) and Ping An Healthcare ($1.54m).

Americas Equity
Americas Equity Finance revenues totaled $381m in May, +3% YoY and +4% MoM. A marginal decrease in average fees (-2% YoY) alongside an increase in average balances for the month (+5% YoY) were the main drivers. Despite the YoY decrease in fees there was a MoM uptick of 7% leading to the highest average fees for the region YTD and highest since June 2021.
Canadian Equities revenue increased +8% YoY producing $31.6m for May. This is a YTD high and highest observed revenue since July 2020. Revenue was generated by offsetting drivers observed in a +16% YoY increase in balances but a decrease of -8% YoY in average fees. US Equities generated $346.8m, with marginal increases of +2% YoY and +3% MoM.

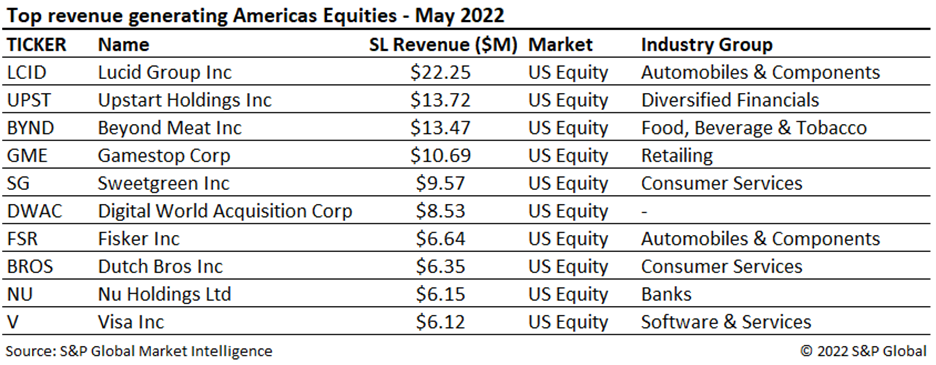
Lucid Group Inc (LCID) and Upstart Holdings Inc (UPST) topped the list for May generating $22.25m (+156% MoM) and $13.72m (+522% MoM) respectively. Lucid and Upstart's ascent to the top of the list was due to an increase in fees of 136% and 769% from April. Sweetgreen Inc (SG), April's top generating name dropped four spots due to avg fees and balances dropping 33% and 27% MoM respectively. While Lucid Group Inc (LCID) is no stranger to this list, Upstart Holding Inc (UPST) faces new challenges in the current economic environment, vaulting the stock up to second on our list as rising interest rates mean borrowers are hesitant to take on debt, suppressing UPST's business model. Two other new entrants into the top 10 were Fisker Inc (FSR) and Dutch Bros Inc (BROS). Both securities saw major spikes in fees from April with deltas of +158% for FSR and +24% for BROS.
European Equity
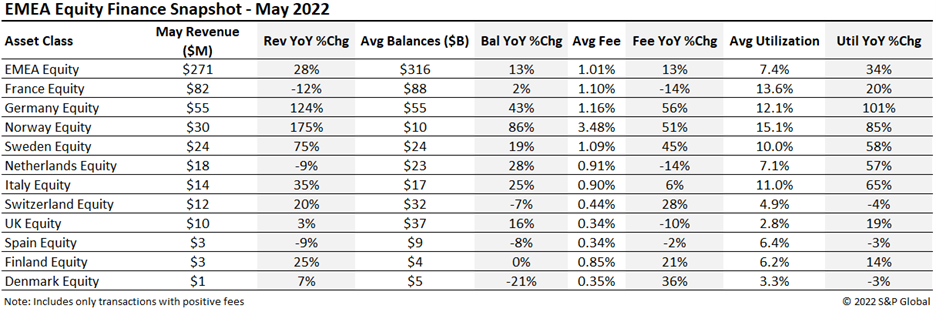
Equity Finance revenue remains robust in Europe for the month of May, generating $271m, up 52% MoM and 28% YoY. A continued increase in balances (7% MoM) and fees (39% MoM) contributed to the highest revenue seen in Europe since September 2021.
France ($82m), Germany ($55m) and Norway ($30m) saw strong securities finance returns with Norway carrying the highest average fee across the region. Increases of utilization in France (32% MoM) and Germany (12% MoM) helped lift revenue but the main driver behind the upswing for those countries was due to fees increasing by 156% MoM and 117% MoM respectively.

Of the top five, French equities held three of the positions including the top spot with Axa Sa (CS) generating $16.57m followed closely by Mercedes-Benz (MBG) with $14.38m. The top 5 revenue generators made up close to 25% of the total regional revenue and all were driven by corporate events.

Depository Receipts
Revenues from lending American Depository Receipts (ADRs) in May continued the downswing with an 8% YoY drop totaling $23m despite May generating the most revenue YTD. ADR securities finance revenues were led by United Microelectronics (UMC) and 51Job (JOBS). UMC contributed 15% of the ADR revenue with $3.52m this month. Loan balances for ADRs dropped to $27b, the lowest figure since June 2020, and an 8% YoY dip in utilization further contributed to the May slump.

Exchange Traded Products
Global ETPs Revenue continues to deliver strong returns in May generating $80m, up 37% YoY. Most metrics showed a slight dip MoM but continued to show positive increases from last year. Average balances were up 24% YoY, average fees were up 10% YoY and utilization held mostly flat YOY at a rate of 12.8%.
Americas ETPs focused on fixed income instruments continue to take four out of the top five spots. Ishares Iboxx $ High Yield Corporate Bond Fund (HYG) generated $8.37m, down 41% MoM off a drop of 30% in average balances. Ishares Iboxx $ Investment Grade Corporate Bond Etf (LQD) came in next keeping the second spot for the second month in a row with $3.66m.

Corporate Bonds
Corporate Bond lending revenues continue to set all-time highs, generating $80m in April, up 93% YoY. Average balances dipped 2% MoM to $284bn, however maintained a 16% YoY increase. Lendable assets dropped to $4.15t, a 4% decrease MoM and a 11% decrease YoY. Fees, however, remained robust at 0.33%. Given the decrease in lendable assets outweigh the marginal decrease in loan balances MoM, utilization increased to 5.8% compared to 5.7% last month, however still up 26% YoY.

Expedia Group Inc 0% note retained its position as the top revenue generator with $0.8m, albeit revenues decreased 16% MoM. The new entry to the top 5 was the Bausch Health Americas 8.5% note with $0.63m monthly revenue due to a sharp increase in fee reaching 2.64%, up 247% MoM.
Government Bonds
Global sovereign debt fee-spread revenues totaled $144m for May, an 8% YoY increase but slightly down MoM. The small downtick in total revenue was due to a reduction in overall balances (-4% MoM) with fees remaining flat MoM.
US government bond lending generated $71.5m, seeing a 6% and 3% decrease YoY and MoM respectively for positive-fee balances. European debt lending generated $53.6m, up 18% YoY and up 1% MoM driven by a slight uptick in average rates of 2% compared to April.
Total government bond lending revenue for agency programs including reinvestment returns and negative fee trades decreased 28% YoY mostly driven by a decrease in reinvestment revenue of 49% YoY.

Conclusion
Global securities finance revenues increased by 16% YoY in May, marking a new YTD high in revenue. Similar demand drivers persisted for May with a less severe decline in ADR revenues. In the wake of a steep hike in interest rates and narrowing spreads between short-term & long-term bonds, the fixed income asset class was marked with uncertainty. The upswing in EMEA revenues was boosted by lingering effects of dividend yields in France and Germany. The use of exchange traded products in institutional long portfolios and for short hedges has resulted in record highs for lendable assets and loan balances, with increased borrow demand likely to continue to bolster revenues going forward. Demand for corporate bonds continued last year's trend, with May monthly revenue seeing a 93% YoY growth.
S&P Global provides industry-leading data, software and technology platforms and managed services to tackle some of the most difficult challenges in financial markets. We help our customers better understand complicated markets, reduce risk, operate more efficiently and comply with financial regulation.
This article was published by S&P Global Market Intelligence and not by S&P Global Ratings, which is a separately managed division of S&P Global.
{"items" : [
{"name":"share","enabled":true,"desc":"<strong>Share</strong>","mobdesc":"Share","options":[ {"name":"facebook","url":"https://www.facebook.com/sharer.php?u=http%3a%2f%2fstage.www.spglobal.com%2fmarketintelligence%2fen%2fmi%2fresearch-analysis%2fsecurities-finance-may-2022-snapshot.html","enabled":true},{"name":"twitter","url":"https://twitter.com/intent/tweet?url=http%3a%2f%2fstage.www.spglobal.com%2fmarketintelligence%2fen%2fmi%2fresearch-analysis%2fsecurities-finance-may-2022-snapshot.html&text=Securities+Finance+May+2022+Snapshot+%7c+S%26P+Global+","enabled":true},{"name":"linkedin","url":"https://www.linkedin.com/sharing/share-offsite/?url=http%3a%2f%2fstage.www.spglobal.com%2fmarketintelligence%2fen%2fmi%2fresearch-analysis%2fsecurities-finance-may-2022-snapshot.html","enabled":true},{"name":"email","url":"?subject=Securities Finance May 2022 Snapshot | S&P Global &body=http%3a%2f%2fstage.www.spglobal.com%2fmarketintelligence%2fen%2fmi%2fresearch-analysis%2fsecurities-finance-may-2022-snapshot.html","enabled":true},{"name":"whatsapp","url":"https://api.whatsapp.com/send?text=Securities+Finance+May+2022+Snapshot+%7c+S%26P+Global+ http%3a%2f%2fstage.www.spglobal.com%2fmarketintelligence%2fen%2fmi%2fresearch-analysis%2fsecurities-finance-may-2022-snapshot.html","enabled":true}]}, {"name":"rtt","enabled":true,"mobdesc":"Top"}
]}


