Customer Logins
Obtain the data you need to make the most informed decisions by accessing our extensive portfolio of information, analytics, and expertise. Sign in to the product or service center of your choice.
Customer Logins
EQUITIES COMMENTARY
Feb 28, 2019
Social media indicators in the UK
Research Signals - February 2019
In March 2014, we introduced a set of social media indicators for US markets, in partnership with Social Market Analytics, Inc., that classify the text content in daily Twitter posts to construct a family of social media signals. We now expand our coverage to the UK market using a similar factor structure.
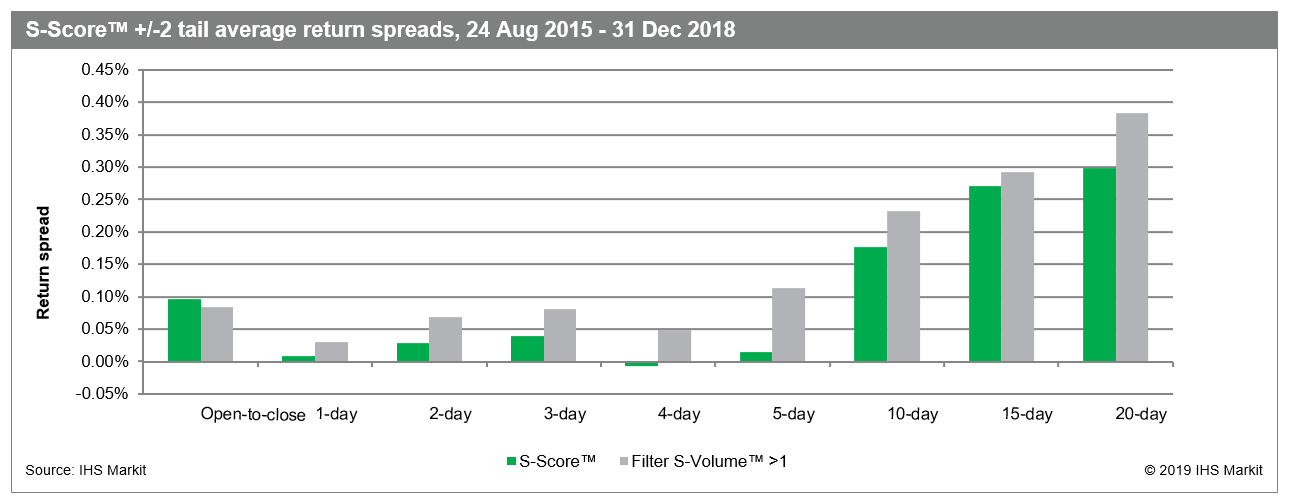
- For names at the extreme tails (2 standard deviations) of the factor distribution, we report notable S-Score™ average daily return spreads of 0.097% since August 2015, with robustness out to longer 10- and 20-day holding periods
- When focusing on frequently tweeted names, average 20-day return spreads improve to 0.383% from 0.298% for the stand-alone strategy, while, for long-only strategies, our empirical results again demonstrate positive performance for names at the 2-standard-deviation tail, with average excess returns of 0.049% on an open-to-close basis, extending to 0.389% out to 20 days
- For Relative Standard Deviation of Indicative Tweet Volume, a Research Signals defined measure of the tweet volume volatility of a stock, we find average daily return spreads of 0.224%, which reached 0.342% at the 20-day horizon

S&P Global provides industry-leading data, software and technology platforms and managed services to tackle some of the most difficult challenges in financial markets. We help our customers better understand complicated markets, reduce risk, operate more efficiently and comply with financial regulation.
This article was published by S&P Global Market Intelligence and not by S&P Global Ratings, which is a separately managed division of S&P Global.
{"items" : [
{"name":"share","enabled":true,"desc":"<strong>Share</strong>","mobdesc":"Share","options":[ {"name":"facebook","url":"https://www.facebook.com/sharer.php?u=http%3a%2f%2fstage.www.spglobal.com%2fmarketintelligence%2fen%2fmi%2fresearch-analysis%2fsocial-media-indicators-in-the-uk.html","enabled":true},{"name":"twitter","url":"https://twitter.com/intent/tweet?url=http%3a%2f%2fstage.www.spglobal.com%2fmarketintelligence%2fen%2fmi%2fresearch-analysis%2fsocial-media-indicators-in-the-uk.html&text=Social+media+indicators+in+the+UK++%7c+S%26P+Global+","enabled":true},{"name":"linkedin","url":"https://www.linkedin.com/sharing/share-offsite/?url=http%3a%2f%2fstage.www.spglobal.com%2fmarketintelligence%2fen%2fmi%2fresearch-analysis%2fsocial-media-indicators-in-the-uk.html","enabled":true},{"name":"email","url":"?subject=Social media indicators in the UK | S&P Global &body=http%3a%2f%2fstage.www.spglobal.com%2fmarketintelligence%2fen%2fmi%2fresearch-analysis%2fsocial-media-indicators-in-the-uk.html","enabled":true},{"name":"whatsapp","url":"https://api.whatsapp.com/send?text=Social+media+indicators+in+the+UK++%7c+S%26P+Global+ http%3a%2f%2fstage.www.spglobal.com%2fmarketintelligence%2fen%2fmi%2fresearch-analysis%2fsocial-media-indicators-in-the-uk.html","enabled":true}]}, {"name":"rtt","enabled":true,"mobdesc":"Top"}
]}


