Resumption of Canadian oil sands helped lower emission intensity in 2021
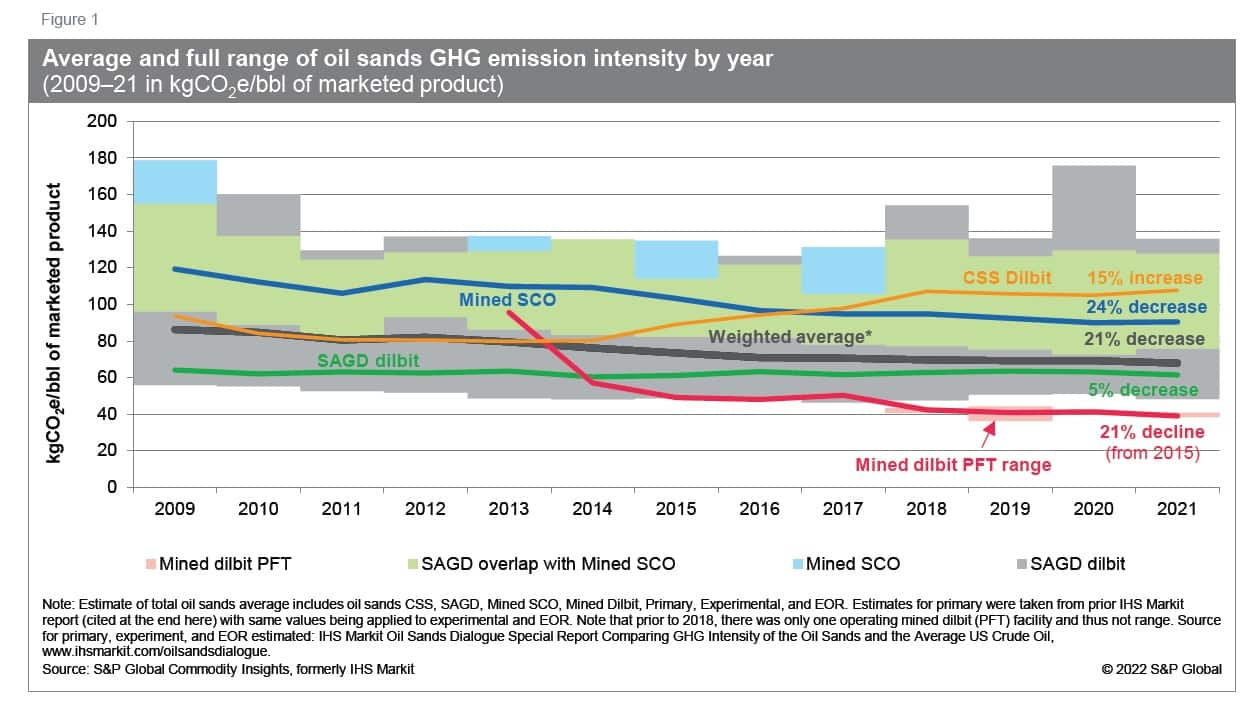
The recovery and ramp-up of oil sands production from the 2020 COVID-19 demand collapse extended into 2021. Total emissions were pushed higher over the year, but the rate of production growth was greater, resulting in a 2% decline in the greenhouse gas (GHG) intensity of Canadian oil sands supply to average just under 68 kgCO₂e/bbl in 2021 (see Figure 1). (1)
A key factor influencing oil sands GHG emissions over the past few years has been the dramatic production swings in response to regional and global market disruptions, the most notable being the pandemic. When oil sands facilities are able to run at higher utilization, unit emissions tend to drop, and vice versa. Despite significant disruptions over the past few years (about 2015-20), the GHG intensity of the oil sands still declined 9% through this period.(2) Since 2009 (the furthest that IHS Markit can estimate), the GHG intensity of oil sands supply has fallen 21%.
In 2021, oil sands output continued to ramp up from various market disruptions over the past few years. Some facilities had never been able to fully ramp up owing to historical and ongoing market disruptions. Recent examples include the 2018 system bottlenecks, which resulted in extreme price differentials in western Canada, Alberta production curtailment in 2019, and the impact of COVID-19 in 2020. In 2021, oil sands supply averaged 3.7 MMb/d, up from 3.4 MMb/d in 2020 and 3.5 MMb/d in 2019. (3)
As production increased in 2021, oil sands industry energy
consumption rose, pushing absolute emissions higher. However,
because GHG intensity is a ratio of total emissions over total
output, as output rose, emissions rose, but not as much as
production lowering the GHG intensity of oil sands products.
Compared with 2020, in 2021 oil sands supply was 9% higher,
absolute emissions increased 7%, and intensity fell nearly 2%.
Compared with 2019—which is arguably a better comparison
year—production was 5% higher, absolute emissions were 3%
greater, and emissions intensity declined 2%.  Looking across the oil sands
sector, the emission intensity spans a considerable range (as shown
by the height of the bars in Figures 1 and 2 in more detail). This
highlights one of the challenges of averages—in that any
individual operation can vary significantly from the average. In
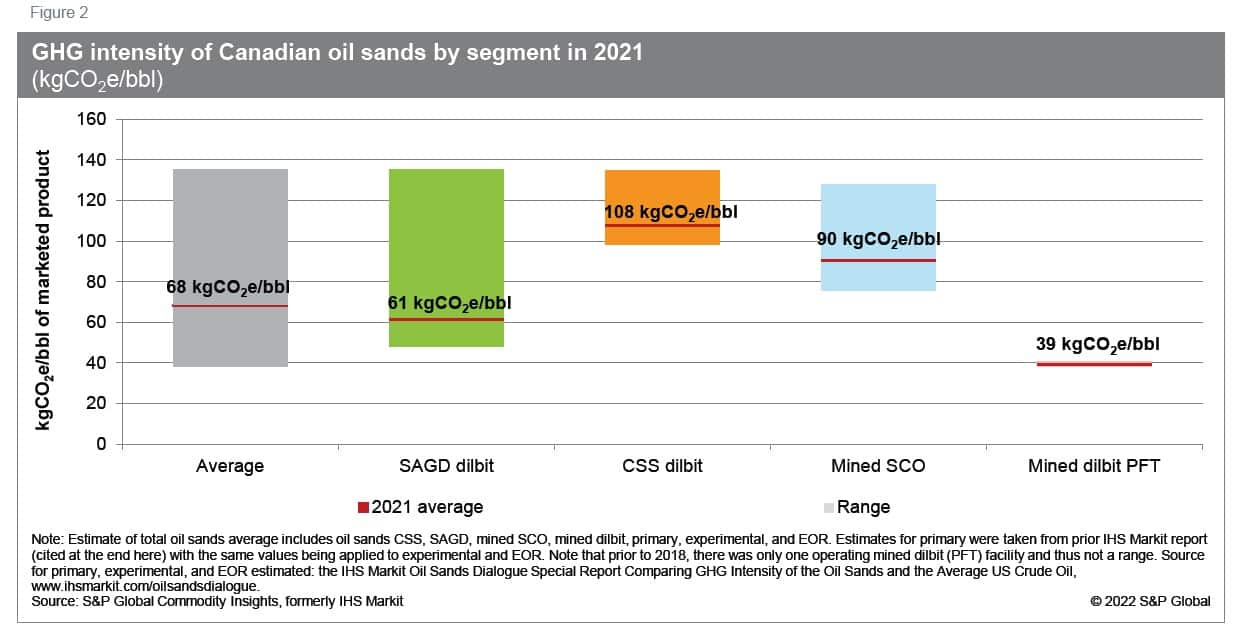
2021, that range spanned over 97 kgCO₂e/bbl, from 38 kgCO₂e/bbl to
136 kgCO₂e/bbl. The upper most range of oil sands facilities' GHG
intensity fell by about 40 kgCO₂e/bbl, or 23%, in 2021 compared
with 2020 but was similar to 2019 levels. This also illustrates the
impact of temporarily throttling output in 2020 on emissions
intensity. Meanwhile, in 2021, the lower bound fell 7%, or about 3
kgCO₂e/bbl, compared with 2020—the lowest that we have
recorded.
Exploring the emissions trends of the various oil sands industry segments can help explain overall sectoral emissions changes. As shown in Figure 2, integrated mines that market synthetic crude oil (SCO)—labeled as Mined SCO in the graph—and cyclic steam stimulation (CSS) plants that market dilbit—labeled as CSS dilbit in the graph—experienced a rise in GHG intensity in 2021,but what was true for the segment was not necessarily true for individual operations.
- Mined SCO. The average GHG intensity of integrated mines was largely unchanged in 2021 compared with 2020, averaging 90 kgCO₂e/bbl in 2021. Four out of the five Mined SCO operations experienced modest intensity reductions. These gains, however, were offset by a more significant rise in intensity from the remaining facility.
- CCS dilbit. CCS dilbit production is highly consolidated in two operations. These two operations took opposite directions in GHG intensity between 2020 and 2021. Improvements at one operation were more than offset by the increases at the other. As a result, the GHG intensity of CCS dilbit ended up increasing 2% in 2021 to average 107 kgCO₂e/bbl.
In contrast, steam-assisted gravity drainage (SAGD) and
unintegrated mines, both of which market dilbit— labeled SAGD
dilbit and Mined dilbit PFT, respectively—experienced intensity
reductions, we believe principally related to higher utilization.

- SAGD dilbit. As a segment, SAGD dilbit experienced the largest reduction in GHG intensity since 2014, falling 3% between 2020 and 2021 to average 61 kgCO₂e/bbl. This segment is diverse and not all operations experienced the same level of improvement. IHS Markit estimates nearly 70% of SAGD facilities experienced an intensity improvement principally owing to greater output. In the end, the improvements at the majority of operations outweighed the losses elsewhere.
- Mined dilbit PFT. The ramp-up of mined dilbit contributed to a 6% GHG intensity improvement from 2020, with a segment average of 39 kgCO₂e/bbl in 2021. This was the lowest annualized GHG intensity for mined dilbit PFT and the lowest recorded intensity in the oil sands.
The key takeaway is that, to understand changes in the oil sands industry's overall emissions intensity profile, a closer look at the trends at individual facilities is required. Higher utilization and thus greater output resulted in lower emissions intensity from SAGD dilbit and mined dilbit PFT—both which were already below the oil sands weighted average. These improvements outweighed the upward pressure from other segments, ultimately reducing the overall industry average intensity lower in 2021. However, as we have documented, what is true for the industry or segment may not have been true for any individual facility—some experienced increases in emissions intensity while others saw decreases.
Looking to the future, predicting shorter-term emissions improvements is challenging as facilities are sensitive to day-to-day operational realities which include market disruptions. In the longer term, the industry is working to put in place larger-scale, longer-lead time emissions abatement solutions, such as carbon capture and storage. The complexity, scale, and economics required to bring these projects online will require greater certainty from regulators and governments, as well as a longer time horizon before they can be expected to have a material impact on oil sands emissions.
IHS Markit oil sands emission boundaries are of marketable products on a system boundary consistent with upstream component of a life-cycle assessment and includes emissions associated with not only fuels and diluents used in oil sands but upstream production as well, and any electrical trade.
(1) Our latest analysis, which incorporates the latest data and modeling updates, revised our assessment for 2020 higher, in which emissions intensity was relatively flat compared with 2019.
(2) Estimated based on average GHG intensity of Canadian oil sands as shown in Figure 1 as measured from 2014 to 2020.
(3) See IHS Markit, Heightened energy security hasn't changed long-term oil sands outlook.
This article was published by S&P Global Commodity Insights and not by S&P Global Ratings, which is a separately managed division of S&P Global.

