Customer Logins
Obtain the data you need to make the most informed decisions by accessing our extensive portfolio of information, analytics, and expertise. Sign in to the product or service center of your choice.
Customer Logins
BLOG
Nov 08, 2018
Securities Lending Q3 Review
- Banner year for EM equity lending continued in Q3
- Lack of specials demand challenged US equity revenues
- Corporate bond demand robust, though revenue uptrend slowing
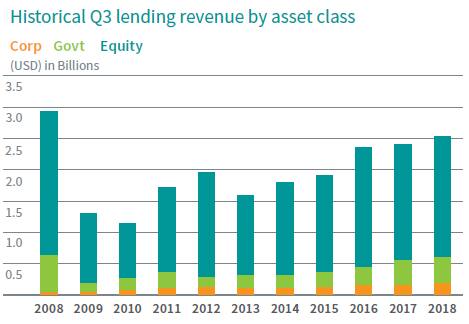
Ten years ago, the third quarter of 2008 delivered $2.9bn in global securities lending revenue, a high-water mark which no third quarter has managed to equal since. The pickup in market volatility in 2018 (after an anemic 2017) has yielded a welcome uptrend in lending revenues this year, however. Extending the trend, the $2.5bn in Q3 revenue was the most since 2008 and represents a 6% increase vs Q3 2017. The growth in industry revenues has been boosted this year by high quality collateral needs, increased EM equity demand, particularly in Asia, demand for corporate bonds and some special situations for equity lending.
Adding the Q3 returns to the $5.8bn in H1 revenues reveals that the first three quarters of 2018 have had the highest post-crisis securities lending revenue. For some context, that is still 27% lower than the first three quarters of 2008.

Government Bonds:
While demand for government bonds has increased significantly in recent years, lending revenues for government paper were 28% lower in the third quarter of this year compared with 2008, when extreme collateral needs boosted fees. Demand for government bonds has remained near an all-time high in 2018, just above $1t. Commensurate with that, revenues have also increased − with the just over $1.3bn earned in the first three quarters of 2018 being the highest post-crisis and 19% above the first 3/4 of 2017. While the demand for government bonds continues to increase, the rate of change has slowed over the last two quarters.
Equities:
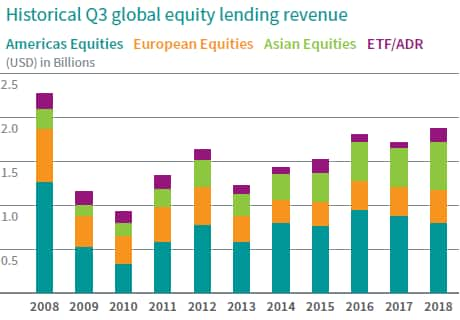
A similar story emerges for equities, with a 6% YOY growth in Q3, though the $1.8bn in revenues was 15% lower than Q3 2008. Despite the rise of fixed income lending, equities still account for more than 76% of global lending revenue, down from 86% in 2014.
Asia has led the growth in equity lending revenue in recent years, with emerging markets playing an increased role this year. Asia equities delivered $563m in Q3 lending revenue, the most for a single quarter on record; Combined with H1 revenues, the $1.5bn total is the highest revenue recorded through the first three quarters of a year, going back to 2006. South Korea was a standout for the 3rd quarter, with Celltrion delivering the most lending revenue for any security globally, as share price appreciation in the quarter did not reduce borrow demand.

A lack of specials demand limited North American lending revenues in Q3. Tesla remained in the warm space, with increased balances driving the stock's $35m in revenues, the 2nd highest for any security in the quarter. In Canada, while the extreme lending fees for Tilray were much discussed, the weighted average lending fee for Cannabis stocks fell during the quarter. That largely resulted from some of the larger borrows in the space, most notably Aurora Cannabis, seeing borrow fees fall on increased share issuance. NA equity revenues came in at $802m, a decline of 8% compared with Q3 2017. An 11th hour revenue boost came in the form of Fortive Corporation's exchange offer for it's automation business. That special situation lending opportunity drove over $19m in revenues in the last week of the quarter for Fortive shareholders who were willing to forgo the opportunity to tender their shares.
European equities delivered $371mm in Q3, a 12% improvement over Q3 2017 and the most lending revenue generated in the 3rd quarter since 2012. Even better news for beneficial owners: Utilization of lendable inventory increased in the 7 of the 10 largest markets by revenue.
Equity Specials:
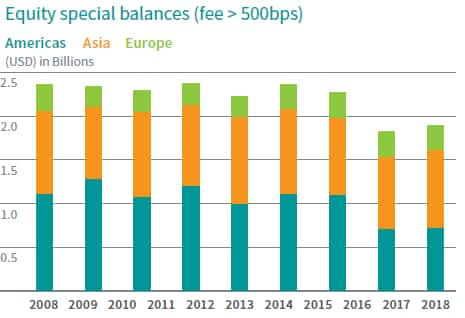
As noted above, the lack of specials balances has hindered US equity lending revenue, which only equated to 38% of lending revenue for common shares in Q3, down from 45% in Q3 of 2017. Looking at balances on loan with fees greater than 500bps, US equities have gone from an average of $9.5bn in the first half of 2018 to an average of $7bn in Q3. After the extremely challenging June for short sellers in hard to borrow stocks, portfolio managers have reduced exposure to US HTB stocks.

It was a similar story in Asia, where average balances with fees greater than 500bps fell to $8.6bn in Q3, down from an average of $9.4bn in the first half of the year. South Korea pushed against that trend, increasing average specials balances by $700m in Q3 relative to H1.
Interestingly, only Europe saw an increase in specials balances in Q3 relative to the first half of the year, however that was moving off a low base of $2.5bn in H1, increasing to $2.8bn in Q3. That was almost entirely the result of CYBG fees moving above 500bps early in the quarter and remaining there for the duration of the quarter.
Corporate Bonds:
Interestingly, corporate bonds are the only asset class to post higher lending revenue YTD compared with 2008, with the $738m in 2018 revenue nearly tripling the returns from a decade ago. That's partly a reflection of reduced broker-dealer inventories, which were a larger source of supply pre-crisis. The Q3 average global corporate bond balance of $196bn is at the higher end of the range observed since late 2015, when credit concerns drove an uptick in demand.
Emerging Markets:
Borrow demand for emerging market equities has been strong amid the underperformance for the asset class globally. The total lending revenue for global EM equities was $331m in Q3, the highest on record both in nominal terms and as a percentage of all equity revenues, just over 17%. Assuming present trends remain in place, global EM will have no difficulty moving past $1bn in total revenue for 2018, which will mark the best year on record.
Chinese ADR's have performed particularly well, generating nearly 10% of all EM equity lending revenue. While BABA gets much of the attention, ex-BABA Chinese ADRs delivered as much revenue in Q3 as they did in all of 2017, just over $26m.
Outside of Asia the revenues are moving off a relatively low base, but are putting up significant percentage gains in Ireland, Greece and Russia. Interestingly despite some increased balances, the YOY increase in Turkish equity lending revenues is only in the high single digits.
While the revenues associated with EM equities are much higher than fixed income, it's interesting to note that in general, revenues have been relatively flat for credit, which earned $47.7m in revenue through the first three quarters of 2018. That total revenue is actually down 8% compared with the first three quarters of 2017. One notable exception is Turkish government bonds, which have more than doubled the return YTD, though the total is only $3.4m, compared with over $18.7m revenue generated by lending Turkish equities.
Wrap up:
October 9th was the 10-year anniversary of the SEC ending the ban on short selling of US financial stocks; the 2.5-week tenure of which saw a 40% reduction in US equity loan balances. Despite the decline in revenues in the last week of Q3 2008, it retains the title of most lending revenue on record for the third quarter. That highlights a key aspect of securities lending: revenues improve in down markets, helping to offset mark to market losses for beneficial owners. While less extreme, the improvement in securities lending revenues this year has helped to offset declining valuations in some sectors, most welcome for emerging market investors. With demand robust across asset classes, the uptrend in revenues doesn't show any signs of slowing down as we move through the 4th quarter of 2018 (though some more US equity specials wouldn't hurt!)
S&P Global provides industry-leading data, software and technology platforms and managed services to tackle some of the most difficult challenges in financial markets. We help our customers better understand complicated markets, reduce risk, operate more efficiently and comply with financial regulation.
This article was published by S&P Global Market Intelligence and not by S&P Global Ratings, which is a separately managed division of S&P Global.
{"items" : [
{"name":"share","enabled":true,"desc":"<strong>Share</strong>","mobdesc":"Share","options":[ {"name":"facebook","url":"https://www.facebook.com/sharer.php?u=http%3a%2f%2fstage.www.spglobal.com%2fmarketintelligence%2fen%2fmi%2fresearch-analysis%2fsecurities-lending-q3-review.html","enabled":true},{"name":"twitter","url":"https://twitter.com/intent/tweet?url=http%3a%2f%2fstage.www.spglobal.com%2fmarketintelligence%2fen%2fmi%2fresearch-analysis%2fsecurities-lending-q3-review.html&text=Securities+Lending+Q3+Review+%7c+S%26P+Global+","enabled":true},{"name":"linkedin","url":"https://www.linkedin.com/sharing/share-offsite/?url=http%3a%2f%2fstage.www.spglobal.com%2fmarketintelligence%2fen%2fmi%2fresearch-analysis%2fsecurities-lending-q3-review.html","enabled":true},{"name":"email","url":"?subject=Securities Lending Q3 Review | S&P Global &body=http%3a%2f%2fstage.www.spglobal.com%2fmarketintelligence%2fen%2fmi%2fresearch-analysis%2fsecurities-lending-q3-review.html","enabled":true},{"name":"whatsapp","url":"https://api.whatsapp.com/send?text=Securities+Lending+Q3+Review+%7c+S%26P+Global+ http%3a%2f%2fstage.www.spglobal.com%2fmarketintelligence%2fen%2fmi%2fresearch-analysis%2fsecurities-lending-q3-review.html","enabled":true}]}, {"name":"rtt","enabled":true,"mobdesc":"Top"}
]}


