Discover more about S&P Global's offerings
Customer Logins
Obtain the data you need to make the most informed decisions by accessing our extensive portfolio of information, analytics, and expertise. Sign in to the product or service center of your choice.
Customer Logins
BLOG
Aug 16, 2024
Electric vehicle adoption trends — It’s not all grim
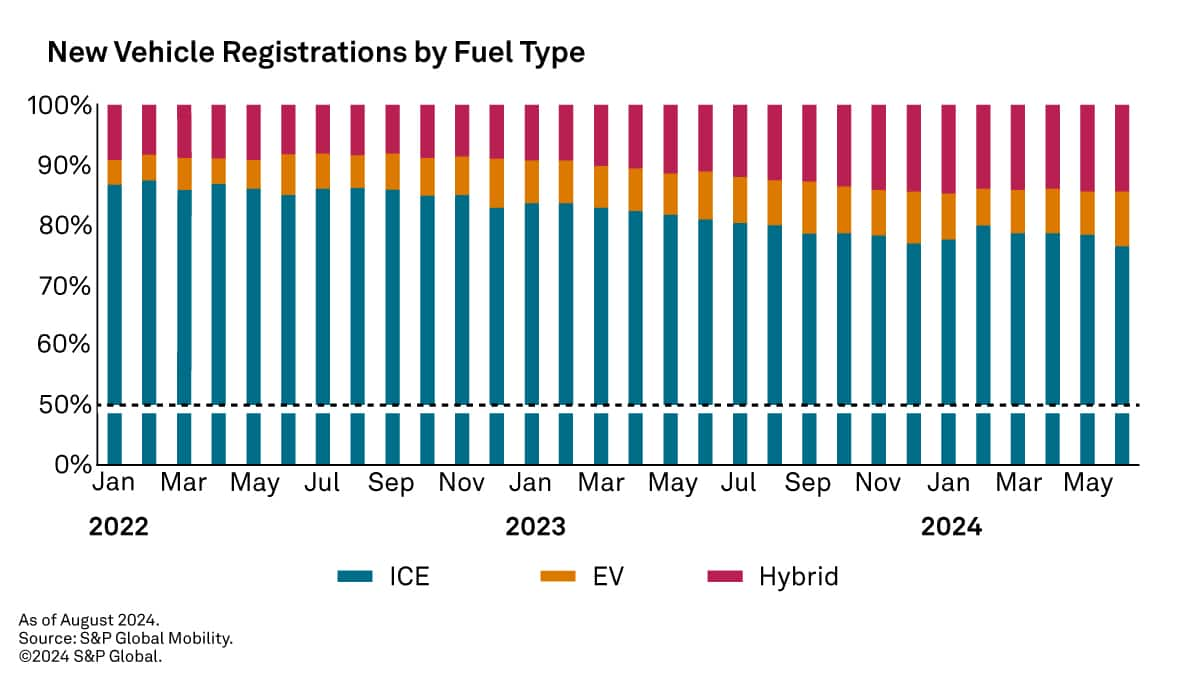
Over the past eight months, the rate of EV new registration growth in the US has plateaued and even pulled back month over month — leading to stories about a slowdown in EV adoption.
But this trend must be viewed in the broader context of how new EVs are transforming the makeup of vehicles in use today.
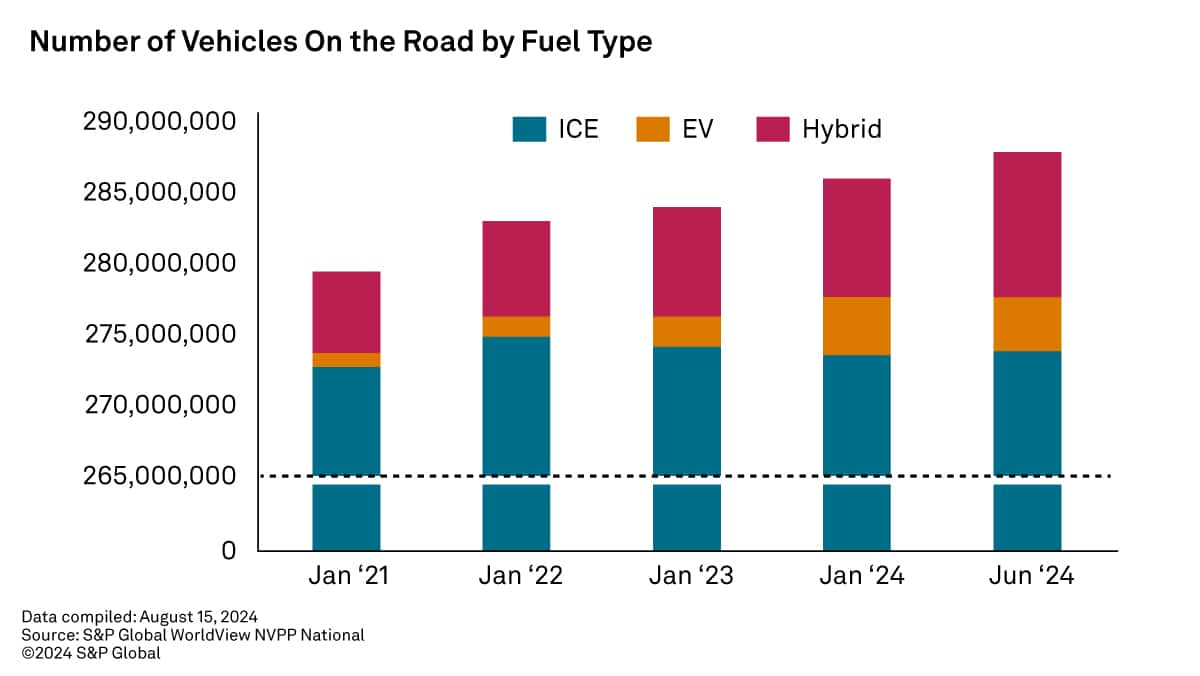
As of January 1, 2024, there were over 286 million passenger cars and light trucks in the United States. At that time, alternative fuel vehicles (EVs and hybrids) accounted for nearly 12.5 million vehicles in use. This number has been consistently on the rise and has doubled since the start of 2020.
In our mid-year review of vehicles on the road on July 1, the overall number had grown by 1.8 million units, to nearly 288 million. Almost 1.6 million (89%) of that growth came from EV and hybrid vehicles!

A Wholistic View of Vehicles on the Road
The EV sales slowdown and the rising popularity of hybrids are still a major focus in the news cycle. Yet, on the shift to alternative propulsions, the impact of time can sometimes be overlooked. Reporting often focuses on year-over-year changes in registrations rather than the long view provided by a more wholistic review of vehicles currently on the road.
By looking at the number of vehicles entering and leaving the fleet — in addition to new registrations — we can more effectively measure efforts to grow EV adoption and reduce the fleet's negative environmental impact.
Measuring Vehicles in Operation
Vehicles tend to have a protracted lifecycle, with the average age of the population sitting at 12.6 years as of January 2024. More than 80 million vehicles are over 16 years of age. Within this context, the real-world impact of new vehicles entering the population can most clearly be understood.
In a typical year, new registrations account for a 5 - 6% addition of vehicles in operation. Additionally, 4 - 5% of all vehicles on the road are retired each year. Various reasons contribute to vehicles retiring from the population, including end of life, total-loss collisions, natural disaster and export, among others. By combining all these factors, we can better understand the change in total share of vehicles on the road over time.

EV Share of Vehicles on the RoadIs Growing Over Time
Although EV new registrations have slowed — and hybrid registrations are growing at a relatively slow pace — the vehicles-in-use data demonstrates the importance of sustained growth over time.
Even at current levels, the rate of EV adoption will continue to reshape the fleet. The new registration pipeline is rich in EV and hybrid vehicles — while the retirement pipeline is primarily aged internal combustion vehicles. As a result, the share of vehicles in use that are more environmentally friendly is increasing more rapidly. While a net zero future for the vehicle fleet has been established as an aspirational goal, there are improvements in efficiency to be enjoyed over time.
Since the start of 2020, the weighted average EPA MPG Combined for vehicles in use — the standard measurement for overall fleet efficiency — has increased by nearly 2 MPG, from 23.68 to 25.41. Even in the current moment — where the rate of growth in adoption of alternative propulsion is slowing — we can still be confident that we are making progress in improving the environmental impact of the vehicle fleet.
S&P Global Mobility provides a single global source for
aftermarket insights, enabling automotive professionals to drive
increased parts revenue and reduced cost with a more comprehensive,
accurate, and timely view of vehicles in operation (VIO), parts
research, aftermarket parts cataloging and VIO forecasts.
Learn more.
This article was published by S&P Global Mobility and not by S&P Global Ratings, which is a separately managed division of S&P Global.
{"items" : [
{"name":"share","enabled":true,"desc":"<strong>Share</strong>","mobdesc":"Share","options":[ {"name":"facebook","url":"https://www.facebook.com/sharer.php?u=http%3a%2f%2fstage.www.spglobal.com%2fmobility%2fen%2fresearch-analysis%2felectric-vehicle-adoption-trends-its-not-all-grim.html","enabled":true},{"name":"twitter","url":"https://twitter.com/intent/tweet?url=http%3a%2f%2fstage.www.spglobal.com%2fmobility%2fen%2fresearch-analysis%2felectric-vehicle-adoption-trends-its-not-all-grim.html&text=Electric+vehicle+adoption+trends+%e2%80%94+It%e2%80%99s+not+all+grim+%7c+S%26P+Global+","enabled":true},{"name":"linkedin","url":"https://www.linkedin.com/sharing/share-offsite/?url=http%3a%2f%2fstage.www.spglobal.com%2fmobility%2fen%2fresearch-analysis%2felectric-vehicle-adoption-trends-its-not-all-grim.html","enabled":true},{"name":"email","url":"?subject=Electric vehicle adoption trends — It’s not all grim | S&P Global &body=http%3a%2f%2fstage.www.spglobal.com%2fmobility%2fen%2fresearch-analysis%2felectric-vehicle-adoption-trends-its-not-all-grim.html","enabled":true},{"name":"whatsapp","url":"https://api.whatsapp.com/send?text=Electric+vehicle+adoption+trends+%e2%80%94+It%e2%80%99s+not+all+grim+%7c+S%26P+Global+ http%3a%2f%2fstage.www.spglobal.com%2fmobility%2fen%2fresearch-analysis%2felectric-vehicle-adoption-trends-its-not-all-grim.html","enabled":true}]}, {"name":"rtt","enabled":true,"mobdesc":"Top"}
]}


